ENRICHING LIVES EXPANDING HORIZONS - Maxis
ENRICHING LIVES EXPANDING HORIZONS - Maxis
ENRICHING LIVES EXPANDING HORIZONS - Maxis

Create successful ePaper yourself
Turn your PDF publications into a flip-book with our unique Google optimized e-Paper software.
138<br />
Financial Statements<br />
NOTES TO THE<br />
FINANCIAL STATEMENTS<br />
31 December 2011<br />
Continued<br />
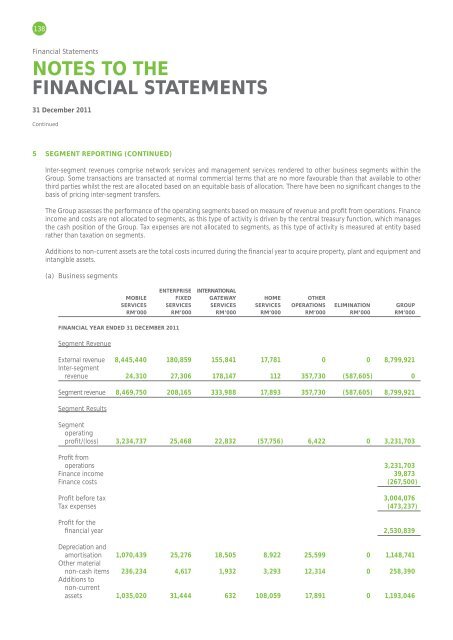
5 SEGMENT REPORTING (CONTINUED)<br />
Inter-segment revenues comprise network services and management services rendered to other business segments within the<br />
Group. Some transactions are transacted at normal commercial terms that are no more favourable than that available to other<br />
third parties whilst the rest are allocated based on an equitable basis of allocation. There have been no significant changes to the<br />
basis of pricing inter-segment transfers.<br />
The Group assesses the performance of the operating segments based on measure of revenue and profit from operations. Finance<br />
income and costs are not allocated to segments, as this type of activity is driven by the central treasury function, which manages<br />
the cash position of the Group. Tax expenses are not allocated to segments, as this type of activity is measured at entity based<br />
rather than taxation on segments.<br />
Additions to non-current assets are the total costs incurred during the financial year to acquire property, plant and equipment and<br />
intangible assets.<br />
(a) Business segments<br />
ENTERPRISE INTERNATIONAL<br />
MOBILE FIXED GATEWAY HOME OTHER<br />
SERVICES SERVICES SERVICES SERVICES OPERATIONS ELIMINATION GROUP<br />
RM’000 RM’000 RM’000 RM’000 RM’000 RM’000 RM’000<br />
FINANCIAL YEAR ENDED 31 DECEMBER 2011<br />
Segment Revenue<br />
External revenue 8,445,440 180,859 155,841 17,781 0 0 8,799,921<br />
Inter-segment<br />
revenue 24,310 27,306 178,147 112 357,730 (587,605) 0<br />
Segment revenue 8,469,750 208,165 333,988 17,893 357,730 (587,605) 8,799,921<br />
Segment Results<br />
Segment<br />
operating<br />
profit/(loss) 3,234,737 25,468 22,832 (57,756) 6,422 0 3,231,703<br />
Profit from<br />
operations 3,231,703<br />
Finance income 39,873<br />
Finance costs (267,500)<br />
Profit before tax 3,004,076<br />
Tax expenses (473,237)<br />
Profit for the<br />
financial year 2,530,839<br />
Depreciation and<br />
amortisation 1,070,439 25,276 18,505 8,922 25,599 0 1,148,741<br />
Other material<br />
non-cash items 236,234 4,617 1,932 3,293 12,314 0 258,390<br />
Additions to<br />
non-current<br />
assets 1,035,020 31,444 632 108,059 17,891 0 1,193,046