Water Users Association and Irrigation Management - Institute for ...
Water Users Association and Irrigation Management - Institute for ...
Water Users Association and Irrigation Management - Institute for ...

You also want an ePaper? Increase the reach of your titles
YUMPU automatically turns print PDFs into web optimized ePapers that Google loves.
management strategies <strong>and</strong> type of crops grown. Each farmer was asked in which year<br />
he/she tirst observed the problem of waterlogging <strong>and</strong> salinity. This was complemented by<br />
enquiry into the nature of change <strong>and</strong> the present status. Farmers assess the nature of<br />
change of the saline <strong>and</strong> waterlogged areas based on the per<strong>for</strong>mance of the crop.<br />
Generally. changes in salinity levels are often judged by farmers on the basis of white<br />
etllorescence due to precipitation of salts or of dark deposits on the soil surface resulting<br />
trom the dispersion of organic matter, <strong>and</strong> the presence of surface crusts <strong>and</strong> hard layers as<br />
evidenced by reduced germination rates. And fanners use many useful indicators by which<br />
they measurc increasc or decrease of waterlogging in the fields. They are ability of crops to<br />
withst<strong>and</strong> wind <strong>and</strong> rains. water levels in the open wells, depletion rate in the drinking <strong>and</strong><br />
livestock ponds. variation in the discharge of tube wells, etc.<br />
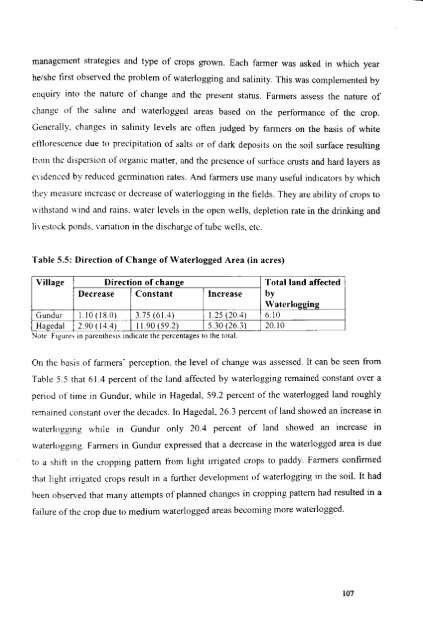
Table 5.5: Direction of Change of <strong>Water</strong>logged Area (in acres)<br />
Village Direction of change Total l<strong>and</strong> affected<br />
Decrease Constant Increase by<br />
<strong>Water</strong>logging<br />
Gundur 110(18.0)<br />
-_<br />
3.75 (61.4) 1.25 (20.4) 6.10<br />
..<br />
Hagedal 2.90(14.4) 11.90 (59.2) 5.30 (26.3) 20.10<br />
Note: FIgures In parentheSIS IndIcate the percentages to the total.<br />
On the hasis of farmers' perception, the level of change was assessed. It can be seen from<br />
Table 5.5 that 61.4 percent of the l<strong>and</strong> affected by waterlogging remained constant over a<br />
period of time in Gundur. while in Hagedal, 59.2 percent of the waterlogged l<strong>and</strong> roughly<br />
remained constant over the decades. [n Hagedal, 26.3 percent ofl<strong>and</strong> showed an increase in<br />
waterlogging while in Gundur only 20.4 percent of l<strong>and</strong> showed an increase in<br />
waterlogging. Farmers in Gundur expressed that a decrease in the waterlogged area is due<br />
to a shift in the cropping pattern from light irrigatcd crops to paddy. Farmers confirmed<br />
that light irrigated crops result in a further development of waterlogging in the soil. It had<br />
heen observed that many attempts of planned changes in cropping pattern had resulted in a<br />
failure of thc crop due to medium waterlogged areas becoming more waterlogged.<br />
107