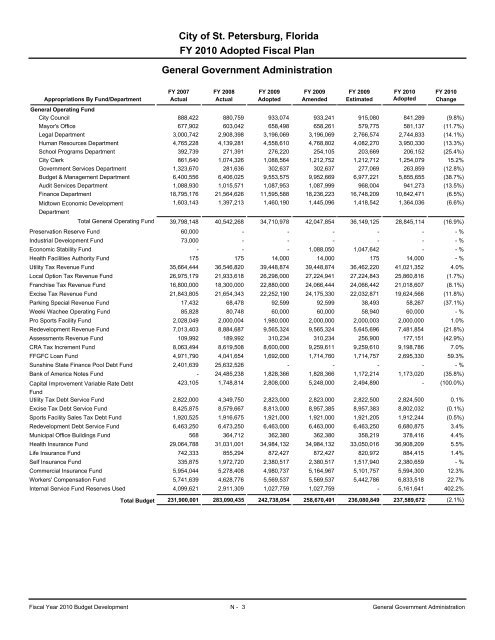
<strong>City</strong> <strong>of</strong> <strong>St</strong>. Petersburg, Florida FY 2010 Adopted Fiscal Plan General Government Administration FY 2007 FY 2008 FY 2009 FY 2009 FY 2009 FY 2010 FY 2010 Appropriations By Fund/Department Actual Actual Adopted Amended Estimated Adopted Change General Operating Fund <strong>City</strong> Council 888,422 880,759 933,074 933,241 915,080 841,289 Mayor's Office 677,902 603,042 658,498 658,261 579,775 581,137 Legal Department 3,000,742 2,908,398 3,196,069 3,196,069 2,766,574 2,744,833 Human Resources Department 4,765,228 4,139,281 4,558,610 4,768,802 4,082,270 3,950,330 School Programs Department 392,739 271,391 276,220 254,105 203,669 206,152 <strong>City</strong> Clerk 861,640 1,074,326 1,088,564 1,212,752 1,212,712 1,254,079 Government Services Department 1,323,670 281,636 302,637 302,637 277,069 263,859 Budget & Management Department 6,400,556 6,406,025 9,553,575 9,952,669 6,977,221 5,855,655 Audit Services Department 1,088,930 1,015,571 1,087,953 1,087,999 968,004 941,273 Finance Department 18,795,176 21,564,626 11,595,588 18,236,223 16,748,209 10,842,471 Midtown Economic Development Department Total General Operating Fund 1,603,143 1,397,213 1,460,190 1,445,096 1,418,542 1,364,036 (9.8%) (11.7%) (14.1%) (13.3%) (25.4%) 15.2% (12.8%) (38.7%) (13.5%) (6.5%) (6.6%) 39,798,148 40,542,268 34,710,978 42,047,854 36,149,125 28,845,114 (16.9%) Preservation Reserve Fund 60,000 - - - - - - % Industrial Development Fund 73,000 - - - - - - % Economic <strong>St</strong>ability Fund - - - 1,088,050 1,047,642 - - % Health Facilities Authority Fund 175 175 14,000 14,000 175 14,000 - % Utility Tax Revenue Fund 35,664,444 36,546,820 39,448,874 39,448,874 36,462,220 41,021,352 4.0% Local Option Tax Revenue Fund 26,975,179 21,933,618 26,298,000 27,224,941 27,224,843 25,860,816 (1.7%) Franchise Tax Revenue Fund 16,800,000 18,300,000 22,880,000 24,066,444 24,066,442 21,018,607 (8.1%) Excise Tax Revenue Fund 21,843,805 21,654,343 22,252,190 24,175,330 22,032,871 19,624,566 (11.8%) Parking Special Revenue Fund 17,432 68,478 92,599 92,599 38,493 58,267 (37.1%) Weeki Wachee Operating Fund 85,828 80,748 60,000 60,000 58,940 60,000 - % Pro Sports Facility Fund 2,028,049 2,000,004 1,980,000 2,000,000 2,000,003 2,000,000 1.0% Redevelopment Revenue Fund 7,013,403 8,884,687 9,565,324 9,565,324 5,645,696 7,481,854 (21.8%) Assessments Revenue Fund 109,992 189,992 310,234 310,234 256,900 177,151 (42.9%) CRA Tax Increment Fund 8,063,494 8,619,508 8,600,000 9,259,611 9,259,610 9,198,786 7.0% FFGFC Loan Fund 4,971,790 4,041,654 1,692,000 1,714,760 1,714,757 2,695,330 59.3% Sunshine <strong>St</strong>ate Finance Pool Debt Fund 2,401,639 25,632,526 - - - - - % Bank <strong>of</strong> America Notes Fund - 24,485,238 1,828,366 1,828,366 1,172,214 1,173,020 (35.8%) Capital Improvement Variable Rate Debt 423,105 1,748,814 2,808,000 5,248,000 2,494,890 - (100.0%) Fund Utility Tax Debt Service Fund 2,822,000 4,349,750 2,823,000 2,823,000 2,822,500 2,824,500 0.1% Excise Tax Debt Service Fund 8,425,875 8,579,667 8,813,000 8,957,385 8,957,383 8,802,032 (0.1%) Sports Facility Sales Tax Debt Fund 1,920,525 1,916,675 1,921,000 1,921,000 1,921,205 1,912,244 (0.5%) Redevelopment Debt Service Fund 6,463,250 6,473,250 6,463,000 6,463,000 6,463,250 6,680,875 3.4% Municipal Office Buildings Fund 568 364,712 362,380 362,380 358,219 378,416 4.4% Health Insurance Fund 29,064,788 31,031,001 34,984,132 34,984,132 33,050,016 36,908,209 5.5% Life Insurance Fund 742,333 855,294 872,427 872,427 820,972 884,415 1.4% Self Insurance Fund 335,875 1,972,720 2,380,517 2,380,517 1,517,940 2,380,659 - % Commercial Insurance Fund 5,954,044 5,278,408 4,980,737 5,164,967 5,101,757 5,594,300 12.3% Workers' Compensation Fund 5,741,639 4,628,776 5,569,537 5,569,537 5,442,786 6,833,518 22.7% Internal Service Fund Reserves Used 4,099,621 2,911,309 1,027,759 1,027,759 - 5,161,641 402.2% Total Budget 231,900,001 283,090,435 242,738,054 258,670,491 236,080,849 237,589,672 (2.1%) Fiscal Year 2010 Budget Development N - 3 General Government Administration
<strong>City</strong> <strong>of</strong> <strong>St</strong>. Petersburg, Florida FY 2010 Adopted Fiscal Plan General Government Administration Property Taxes Franchise Taxes Utility Taxes Business Taxes Contractors Permits Other Licenses & Permits Grants Shared Revenues General Government Other Charges for Services Interest Earnings Rents & Royalties Special Assessments Sale <strong>of</strong> Fixed Assets Contributions & Donations Miscellaneous Revenue Interfund Transfers Debt Proceeds Department Charges General Operating Fund Preservation Reserve Fund FY 2007 FY 2008 FY 2009 FY 2009 FY 2009 FY 2010 FY 2010 Revenue Sources Actual Actual Adopted Amended Estimated Adopted Change Industrial Development Fund Economic <strong>St</strong>ability Fund Health Facilities Authority Fund Utility Tax Revenue Fund Local Option Tax Revenue Fund Franchise Tax Revenue Fund Excise Tax Revenue Fund Parking Special Revenue Fund School Crossing Guard Trust Fund Weeki Wachee Operating Fund Arts & Cultural Programs Fund Pro Sports Facility Fund Redevelopment Revenue Fund Assessments Revenue Fund CRA Tax Increment Fund FFGFC Loan Fund Sunshine <strong>St</strong>ate Finance Pool Debt Fund Bank <strong>of</strong> America Notes Fund Capital Improvement Variable Rate Debt Fund Utility Tax Debt Service Fund Excise Tax Debt Service Fund Sports Facility Sales Tax Debt Fund Redevelopment Debt Service Fund Municipal Office Buildings Fund Health Insurance Fund Life Insurance Fund Self Insurance Fund Commercial Insurance Fund Workers' Compensation Fund Internal Service Fund Reserves Used 104,354,857 101,569,443 95,639,638 95,639,638 95,140,128 83,608,761 (12.6%) 19,245,687 18,922,608 20,550,000 20,550,000 21,014,619 21,818,607 6.2% 36,637,290 36,706,685 37,049,874 37,049,874 38,633,872 39,175,352 5.7% 3,048,711 2,950,447 2,820,000 2,820,000 2,596,244 2,820,000 - % 7,317 4,960 10,000 10,000 4,750 2,000 (80.0%) 14,000 25,375 - - 4,250 5,000 - % 443,977 254,157 150,000 150,000 825,788 142,000 (5.3%) 65,771,798 64,261,277 64,846,997 64,846,997 60,743,501 59,080,427 (8.9%) 118,742 69,888 91,800 91,800 (2) 88,000 (4.1%) 247,190 121,281 50,600 78,550 140,345 50,600 - % 7,812,391 (1,058,373) 3,780,533 3,780,533 5,614,065 2,982,684 (21.1%) 138,083 104,569 23,000 23,000 94,956 23,000 - % 156,206 37,266 100,000 100,000 104,641 140,000 40.0% - - 130,378 130,378 - 10,000 (92.3%) 26,300 1,877 - - 159 420 - % 775,761 828,536 517,064 517,064 429,893 729,285 41.0% 123,417,009 149,450,175 129,745,822 135,766,925 129,593,214 129,839,494 0.1% - 32,851,565 - - - - - % 47,859,543 46,316,155 47,933,960 47,933,960 46,754,344 49,908,455 4.1% (162,842,747) (161,230,292) (166,588,421) (159,300,598) (159,484,958) (162,024,499) (2.7%) 11,230 (22,374) (30,000) (30,000) (3,917) (12,000) (60.0%) 64,264 (11,741) (2,000) (2,000) (482) (2,000) - % (2,735,806) 410,441 (300,000) (5,211,950) (5,260,012) (500,000) 66.7% (2,626) (13,203) - - (9,911) - - % (1,032,579) (160,028) 2,398,000 2,398,000 (2,171,519) 1,846,000 (23.0%) 165,291 (4,341,117) - 926,941 2,871,898 1,991,190 - % (1,869,954) (22,117) 3,130,000 4,316,444 3,847,251 (558,170) (117.8%) (510,966) 128,968 1,027,190 2,950,330 2,165,866 - (100.0%) 17,432 67,478 92,599 92,599 38,439 58,267 (37.1%) - 27,000 - - 30,000 - - % (2,038,790) 2,281,993 (550,000) (550,000) (1,212,821) (240,000) (56.4%) - - (100,000) (100,000) (99,996) - (100.0%) 20,127 (2,294) (30,000) (10,000) (1,305) (10,000) (66.7%) (1,113,845) 269,587 965,324 965,324 (3,752,254) (1,716,932) (277.9%) (76,013) 120,973 130,234 130,234 114,725 (2,849) (102.2%) (566,685) (590,475) (1,855,975) (1,196,364) (765,918) (20,001) (98.9%) 348,361 - - 22,760 517,252 - - % 163,384 531,021 - - - - - % - - - - (610,027) 33,152 - % - - - 2,440,000 - - - % (509,252) 2,037,950 (125,500) (125,500) (668) 941,500 (850.2%) (122,901) (9,131,588) (137,000) 7,385 (133,918) (148,375) 8.3% (5,650) (15,500) (5,000) (5,000) (4,031) (17,006) 240.1% (455) 6,624 - - 1,633,000 - - % 568 364,712 362,380 362,380 358,219 378,416 4.4% (4,337,148) (915,384) 93,292 93,292 (796,538) 1,574,807 1,588.0% (36,784) 94,202 42,378 42,378 48,456 66,660 57.3% (2,916,459) (1,194,817) (198,327) (198,327) (2,022,373) (189,341) (4.5%) (2,629,649) (650,892) (45,115) 139,115 (97,564) 443,300 (1,082.6%) 283,170 (1,277,892) (3,430) (3,430) (810,812) 111,827 (3,360.3%) 4,099,621 2,911,309 1,027,759 1,027,759 - 5,161,641 402.2% Total Revenue 231,900,001 283,090,435 242,738,054 258,670,491 236,080,849 237,589,672 (2.1%) Fiscal Year 2010 Budget Development N - 4 General Government Administration
- Page 1 and 2:
CITY OF ST. PETERSBURG, FLORIDA ADO
- Page 3:
CITY OF ST. PETERSBURG ADOPTED OPER
- Page 7 and 8:
City of St. Petersburg, Florida FY
- Page 9 and 10:
City of St. Petersburg, Florida FY
- Page 11 and 12:
City of St. Petersburg, Florida FY
- Page 13 and 14:
City of St. Petersburg, Florida FY
- Page 15 and 16:
A EXECUTIVE SUMMARY
- Page 17 and 18:
City of St. Petersburg, Florida FY1
- Page 19 and 20:
City of St. Petersburg, Florida FY1
- Page 21 and 22:
City of St. Petersburg, Florida FY1
- Page 23 and 24:
City of St. Petersburg, Florida FY1
- Page 25 and 26:
City of St. Petersburg, Florida FY1
- Page 27 and 28:
City of St. Petersburg, Florida FY1
- Page 29 and 30:
City of St. Petersburg, Florida FY1
- Page 31 and 32:
City of St. Petersburg, Florida FY1
- Page 33 and 34:
City of St. Petersburg, Florida FY1
- Page 35 and 36:
City of St. Petersburg, Florida FY1
- Page 37 and 38:
City of St. Petersburg, Florida FY1
- Page 39 and 40:
City of St. Petersburg, Florida FY1
- Page 41 and 42:
City of St. Petersburg, Florida FY1
- Page 43 and 44:
City of St. Petersburg, Florida FY1
- Page 45 and 46:
City of St. Petersburg, Florida FY1
- Page 47 and 48:
City of St. Petersburg, Florida FY1
- Page 49 and 50:
City of St. Petersburg, Florida FY1
- Page 51 and 52:
City of St. Petersburg, Florida FY1
- Page 53 and 54:
City of St. Petersburg, Florida FY1
- Page 55 and 56:
City of St. Petersburg, Florida FY1
- Page 57 and 58:
City of St. Petersburg, Florida FY
- Page 59 and 60:
City of St. Petersburg, Florida FY
- Page 61 and 62:
City of St. Petersburg, Florida FY
- Page 63 and 64:
City of St. Petersburg, Florida FY
- Page 65 and 66:
City of St. Petersburg, Florida FY
- Page 67 and 68:
C PERSONNEL SUMMARY
- Page 69 and 70:
FTE By Department City of St. Peter
- Page 71 and 72:
Department FTE City of St. Petersbu
- Page 73 and 74:
Department FTE City of St. Petersbu
- Page 75 and 76:
FY 2010 Adopted Fiscal Plan Positio
- Page 77 and 78:
FY 2010 Adopted Fiscal Plan Positio
- Page 79 and 80:
City of St. Petersburg, Florida FY
- Page 81 and 82:
City of St. Petersburg, Florida FY
- Page 83 and 84:
City of St. Petersburg, Florida FY
- Page 85 and 86:
City of St. Petersburg, Florida FY
- Page 87 and 88:
D REVENUE HIGHLIGHTS /OVERVIEW
- Page 89 and 90:
City of St. Petersburg, Florida FY
- Page 91 and 92:
City of St. Petersburg, Florida FY
- Page 93 and 94:
City of St. Petersburg, Florida FY
- Page 95 and 96:
City of St. Petersburg, Florida FY
- Page 97 and 98:
City of St. Petersburg, Florida FY
- Page 99 and 100:
City of St. Petersburg, Florida FY
- Page 101 and 102:
E OPERATING FUND SUMMARIES
- Page 103 and 104:
City of St. Petersburg, Florida FY
- Page 105 and 106:
Fund City of St. Petersburg, Florid
- Page 107 and 108:
City of St. Petersburg, Florida FY
- Page 109 and 110:
City of St. Petersburg, Florida FY
- Page 111 and 112:
City of St. Petersburg, Florida FY
- Page 113 and 114:
City of St. Petersburg, Florida FY
- Page 115 and 116:
City of St. Petersburg, Florida FY
- Page 117 and 118:
City of St. Petersburg, Florida FY
- Page 119 and 120:
City of St. Petersburg, Florida FY
- Page 121 and 122:
City of St. Petersburg, Florida FY
- Page 123 and 124:
City of St. Petersburg, Florida FY
- Page 125 and 126:
F GENERAL FUND SUMMARIES
- Page 127 and 128:
City of St. Petersburg, Florida FY
- Page 129 and 130:
City of St. Petersburg, Florida FY
- Page 131 and 132:
City of St. Petersburg, Florida FY
- Page 133 and 134:
City of St. Petersburg, Florida FY
- Page 135 and 136:
City of St. Petersburg, Florida FY
- Page 137 and 138:
City of St. Petersburg, Florida FY
- Page 139 and 140:
City of St. Petersburg, Florida FY
- Page 141 and 142:
City of St. Petersburg, Florida FY
- Page 143 and 144:
City of St. Petersburg, Florida FY
- Page 145 and 146:
H SPECIAL REVENUE FUNDS SUMMARIES
- Page 147 and 148:
City of St. Petersburg, Florida FY
- Page 149 and 150:
City of St. Petersburg, Florida FY
- Page 151 and 152:
City of St. Petersburg, Florida FY
- Page 153 and 154:
City of St. Petersburg, Florida FY
- Page 155 and 156:
City of St. Petersburg, Florida FY
- Page 157 and 158:
City of St. Petersburg, Florida FY
- Page 159 and 160:
City of St. Petersburg, Florida FY
- Page 161 and 162:
City of St. Petersburg, Florida FY
- Page 163 and 164:
City of St. Petersburg, Florida FY
- Page 165 and 166:
I SPECIAL REVENUE FUNDS SUMMARIES -
- Page 167 and 168:
City of St. Petersburg, Florida FY
- Page 169 and 170:
City of St. Petersburg, Florida FY
- Page 171 and 172:
City of St. Petersburg, Florida FY
- Page 173 and 174:
City of St. Petersburg, Florida FY
- Page 175 and 176:
City of St. Petersburg, Florida FY
- Page 177 and 178:
City of St. Petersburg, Florida FY
- Page 179 and 180:
City of St. Petersburg, Florida FY
- Page 181 and 182:
City of St. Petersburg, Florida FY
- Page 183 and 184:
City of St. Petersburg, Florida FY
- Page 185 and 186:
City of St. Petersburg, Florida FY
- Page 187 and 188:
City of St. Petersburg, Florida FY
- Page 189 and 190:
City of St. Petersburg, Florida FY
- Page 191 and 192:
City of St. Petersburg, Florida FY
- Page 193 and 194:
City of St. Petersburg, Florida FY
- Page 195 and 196: City of St. Petersburg, Florida FY
- Page 197 and 198: City of St. Petersburg, Florida FY
- Page 199 and 200: City of St. Petersburg, Florida FY
- Page 201 and 202: City of St. Petersburg, Florida FY
- Page 203 and 204: City of St. Petersburg, Florida FY
- Page 205 and 206: L CITY DEVELOPMENT ADMINISTRATION
- Page 207 and 208: City of St. Petersburg, Florida FY
- Page 209 and 210: Department Mission Statement City o
- Page 211 and 212: City of St. Petersburg, Florida FY
- Page 213 and 214: City of St. Petersburg, Florida FY
- Page 215 and 216: Department Mission Statement City o
- Page 217 and 218: Department Mission Statement City o
- Page 219 and 220: City of St. Petersburg, Florida FY
- Page 221 and 222: Department Mission Statement City o
- Page 223 and 224: Department Mission Statement City o
- Page 225 and 226: M CITY SERVICES ADMINISTRATION
- Page 227 and 228: City of St. Petersburg, Florida FY
- Page 229 and 230: Department Mission Statement City o
- Page 231 and 232: City of St. Petersburg, Florida FY
- Page 233 and 234: City of St. Petersburg, Florida FY
- Page 235 and 236: City of St. Petersburg, Florida FY
- Page 237 and 238: City of St. Petersburg, Florida FY
- Page 239 and 240: Department Mission Statement City o
- Page 241 and 242: Department Mission Statement City o
- Page 243 and 244: N GENERAL GOVERNMENT
- Page 245: City of St. Petersburg, Florida FY
- Page 249 and 250: Department Mission Statement City o
- Page 251 and 252: Department Mission Statement City o
- Page 253 and 254: Department Mission Statement City o
- Page 255 and 256: City of St. Petersburg, Florida FY
- Page 257 and 258: Department Mission Statement City o
- Page 259 and 260: Department Mission Statement City o
- Page 261 and 262: Department Mission Statement City o
- Page 263 and 264: City of St. Petersburg, Florida FY
- Page 265 and 266: City of St. Petersburg, Florida FY
- Page 267 and 268: City of St. Petersburg, Florida FY
- Page 269 and 270: City of St. Petersburg, Florida FY
- Page 271 and 272: City of St. Petersburg, Florida FY
- Page 273 and 274: City of St. Petersburg, Florida FY
- Page 275 and 276: Department Mission Statement City o
- Page 277 and 278: City of St. Petersburg, Florida FY
- Page 279 and 280: City of St. Petersburg, Florida FY
- Page 281 and 282: City of St. Petersburg, Florida FY
- Page 283 and 284: City of St. Petersburg, Florida FY
- Page 285 and 286: City of St. Petersburg, Florida FY
- Page 287 and 288: City of St. Petersburg, Florida FY
- Page 289 and 290: Department Mission Statement City o
- Page 291 and 292: Department Mission Statement City o
- Page 293 and 294: City of St. Petersburg, Florida FY
- Page 295 and 296: City of St. Petersburg, Florida FY
- Page 297 and 298:
City of St. Petersburg, Florida FY
- Page 299 and 300:
City of St. Petersburg, Florida FY
- Page 301 and 302:
City of St. Petersburg, Florida FY
- Page 303 and 304:
City of St. Petersburg, Florida FY
- Page 305 and 306:
Department Mission Statement City o
- Page 307 and 308:
City of St. Petersburg, Florida FY
- Page 309 and 310:
City of St. Petersburg, Florida FY
- Page 311 and 312:
City of St. Petersburg, Florida FY
- Page 313 and 314:
City of St. Petersburg, Florida FY
- Page 315 and 316:
Department Mission Statement City o
- Page 317 and 318:
City of St. Petersburg, Florida FY
- Page 319 and 320:
City of St. Petersburg, Florida FY
- Page 321 and 322:
City of St. Petersburg, Florida FY
- Page 323 and 324:
City of St. Petersburg, Florida FY
- Page 325 and 326:
City of St. Petersburg, Florida FY
- Page 327 and 328:
T FY10 CIP BUDGET INTRODUCTION
- Page 329 and 330:
City of St. Petersburg, Florida FY
- Page 331 and 332:
U SUMMARY OF ALL CIP FUNDS 2010-201
- Page 333 and 334:
City of St. Petersburg, Florida 201
- Page 335 and 336:
City of St. Petersburg, Florida 201
- Page 337 and 338:
City of St. Petersburg, Florida 201
- Page 339 and 340:
City of St. Petersburg, Florida 201
- Page 341 and 342:
City of St. Petersburg, Florida 201
- Page 343 and 344:
City of St. Petersburg, Florida 201
- Page 345 and 346:
City of St. Petersburg, Florida FY
- Page 347 and 348:
City of St. Petersburg, Florida 201
- Page 349 and 350:
Project Descriptions City of St. Pe
- Page 351 and 352:
City of St. Petersburg, Florida 201
- Page 353 and 354:
City of St. Petersburg, Florida 201
- Page 355 and 356:
Project Descriptions City of St. Pe
- Page 357 and 358:
City of St. Petersburg, Florida 201
- Page 359 and 360:
City of St. Petersburg, Florida 201
- Page 361 and 362:
X ENTERPRISE FUNDS
- Page 363 and 364:
City of St. Petersburg, Florida 201
- Page 365 and 366:
City of St. Petersburg, Florida 201
- Page 367 and 368:
City of St. Petersburg, Florida 201
- Page 369 and 370:
City of St. Petersburg, Florida 201
- Page 371 and 372:
City of St. Petersburg, Florida 201
- Page 373 and 374:
City of St. Petersburg, Florida 201
- Page 375 and 376:
City of St. Petersburg, Florida 201
- Page 377 and 378:
City of St. Petersburg, Florida 201
- Page 379 and 380:
City of St. Petersburg, Florida 201
- Page 381 and 382:
City of St. Petersburg, Florida 201
- Page 383 and 384:
City of St. Petersburg, Florida 201
- Page 385 and 386:
City of St. Petersburg, Florida 201
- Page 387 and 388:
City of St. Petersburg, Florida 201
- Page 389 and 390:
Z APPENDIX
- Page 391 and 392:
City of St. Petersburg, Florida FY
- Page 393 and 394:
City of St. Petersburg, Florida FY
- Page 395 and 396:
City of St. Petersburg, Florida FY
- Page 397 and 398:
City of St. Petersburg, Florida FY
- Page 399 and 400:
City of St. Petersburg, Florida FY
- Page 401 and 402:
department’s work program for the
- Page 403 and 404:
Program: A distinct function of Cit
- Page 405 and 406:
City of St. Petersburg, Florida FY
- Page 407 and 408:
From spring to fall, Saturday morni