adopted operating & capital improvement budget - City of St ...
adopted operating & capital improvement budget - City of St ...
adopted operating & capital improvement budget - City of St ...

Create successful ePaper yourself
Turn your PDF publications into a flip-book with our unique Google optimized e-Paper software.
Department Mission <strong>St</strong>atement<br />
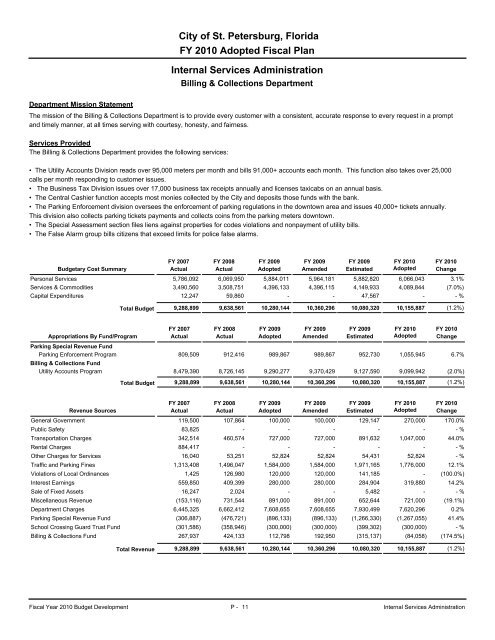
<strong>City</strong> <strong>of</strong> <strong>St</strong>. Petersburg, Florida<br />
FY 2010 Adopted Fiscal Plan<br />
Internal Services Administration<br />
Billing & Collections Department<br />
The mission <strong>of</strong> the Billing & Collections Department is to provide every customer with a consistent, accurate response to every request in a prompt<br />
and timely manner, at all times serving with courtesy, honesty, and fairness.<br />
Services Provided<br />
The Billing & Collections Department provides the following services:<br />
• The Utility Accounts Division reads over 95,000 meters per month and bills 91,000+ accounts each month. This function also takes over 25,000<br />
calls per month responding to customer issues.<br />
• The Business Tax Division issues over 17,000 business tax receipts annually and licenses taxicabs on an annual basis.<br />
• The Central Cashier function accepts most monies collected by the <strong>City</strong> and deposits those funds with the bank.<br />
• The Parking Enforcement division oversees the enforcement <strong>of</strong> parking regulations in the downtown area and issues 40,000+ tickets annually.<br />
This division also collects parking tickets payments and collects coins from the parking meters downtown.<br />
• The Special Assessment section files liens against properties for codes violations and nonpayment <strong>of</strong> utility bills.<br />
• The False Alarm group bills citizens that exceed limits for police false alarms.<br />
FY 2007 FY 2008 FY 2009 FY 2009 FY 2009 FY 2010 FY 2010<br />
Budgetary Cost Summary Actual Actual Adopted Amended Estimated Adopted Change<br />
Personal Services<br />
Services & Commodities<br />
Capital Expenditures<br />
5,786,092 6,069,950 5,884,011 5,964,181 5,882,820 6,066,043<br />
3,490,560 3,508,751 4,396,133 4,396,115 4,149,933 4,089,844<br />
12,247 59,860 -<br />
- 47,567 -<br />
3.1%<br />
(7.0%)<br />
- %<br />
Total Budget 9,288,899 9,638,561 10,280,144 10,360,296 10,080,320 10,155,887<br />
(1.2%)<br />
FY 2007 FY 2008 FY 2009 FY 2009 FY 2009 FY 2010 FY 2010<br />
Appropriations By Fund/Program Actual Actual Adopted Amended Estimated Adopted Change<br />
Parking Special Revenue Fund<br />
Parking Enforcement Program 809,509 912,416 989,867 989,867 952,730 1,055,945<br />
Billing & Collections Fund<br />
Utility Accounts Program 8,479,390 8,726,145 9,290,277 9,370,429 9,127,590 9,099,942<br />
Total Budget<br />
6.7%<br />
(2.0%)<br />
9,288,899 9,638,561 10,280,144 10,360,296 10,080,320 10,155,887 (1.2%)<br />
General Government<br />
Public Safety<br />
Transportation Charges<br />
Rental Charges<br />
Other Charges for Services<br />
Traffic and Parking Fines<br />
FY 2007 FY 2008 FY 2009 FY 2009 FY 2009 FY 2010 FY 2010<br />
Revenue Sources Actual Actual Adopted Amended Estimated Adopted Change<br />
Violations <strong>of</strong> Local Ordinances<br />
Interest Earnings<br />
Sale <strong>of</strong> Fixed Assets<br />
Miscellaneous Revenue<br />
Department Charges<br />
Parking Special Revenue Fund<br />
School Crossing Guard Trust Fund<br />
Billing & Collections Fund<br />
119,500 107,864 100,000 100,000 129,147 270,000<br />
83,825 - -<br />
-<br />
- -<br />
342,514 460,574 727,000 727,000 891,632 1,047,000<br />
884,417 - -<br />
-<br />
- -<br />
16,040 53,251 52,824 52,824 54,431 52,824<br />
1,313,408 1,496,047 1,584,000 1,584,000 1,971,165 1,776,000<br />
1,425 126,980 120,000 120,000 141,185 -<br />
559,850 409,399 280,000 280,000 284,904 319,880<br />
16,247 2,024 -<br />
-<br />
5,482 -<br />
(153,116) 731,544 891,000 891,000 652,644 721,000<br />
6,445,325 6,662,412 7,608,655 7,608,655 7,930,499 7,620,296<br />
(306,887) (476,721) (896,133) (896,133) (1,266,330) (1,267,055)<br />
(301,586) (358,946) (300,000) (300,000) (399,302) (300,000)<br />
267,937 424,133 112,798 192,950 (315,137) (84,058)<br />
170.0%<br />
- %<br />
44.0%<br />
- %<br />
- %<br />
12.1%<br />
(100.0%)<br />
14.2%<br />
- %<br />
(19.1%)<br />
0.2%<br />
41.4%<br />
- %<br />
(174.5%)<br />
Total Revenue 9,288,899 9,638,561 10,280,144 10,360,296 10,080,320 10,155,887<br />
(1.2%)<br />
Fiscal Year 2010 Budget Development P - 11 Internal Services Administration