- Page 1 and 2: 2004 Survey of Customer Satisfactio
- Page 3 and 4: VII. TEA WEBSITE ..................
- Page 5 and 6: LIST OF TABLES Table 1 Customer Pop
- Page 7 and 8: Table 54 Visited TEA Website for Da
- Page 9 and 10: II. METHODOLOGY Instrument TEA desi
- Page 11 and 12: There appears to have been some dif
- Page 13 and 14: ESC Region 01 02 03 04 05 06 07 08
- Page 15 and 16: ESC Region 01 02 03 04 05 06 07 08
- Page 17 and 18: ESC Region 01 02 03 04 05 06 07 08
- Page 19 and 20: • ESC Region 01 02 03 04 05 06 07
- Page 21 and 22: Table 8 Method of Contacting TEA Fo
- Page 23 and 24: Table 9 Method of Contacting TEA Fo
- Page 25: Table 10 Method of Contacting TEA F
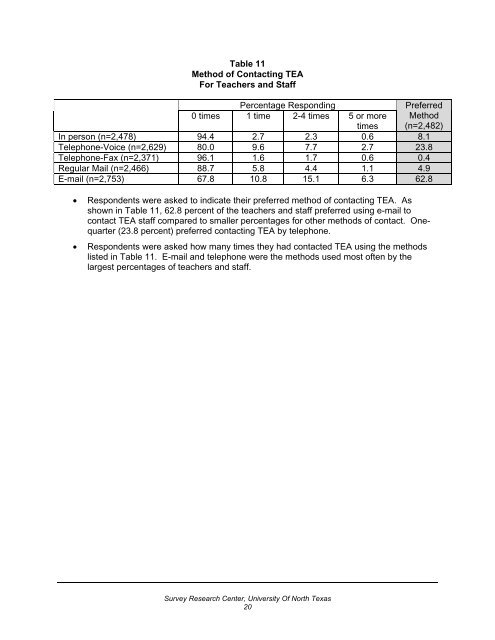
- Page 29 and 30: Table 13 Methods Used to Contact TE
- Page 31 and 32: Accountability and Data Quality Tab
- Page 33 and 34: School Finance and Fiscal Analysis
- Page 35 and 36: Operations and Fiscal Management Ta
- Page 37 and 38: Table 21 Methods Used to Contact TE
- Page 39 and 40: Table 23 TEA Provides Reliable and
- Page 41 and 42: Table 25 TEA is Responsive to E-mai
- Page 43 and 44: Process Table 27 Contacts are Usual
- Page 45 and 46: Table 29 My Complaint Would be Addr
- Page 47 and 48: Principals • The combined percent
- Page 49 and 50: Table 32 Overall Satisfaction with
- Page 51 and 52: Table 34 Overall Satisfaction with
- Page 53 and 54: Table 36 Effectiveness of Electroni
- Page 55 and 56: Table 38 TEA Program Guidance/Curri
- Page 57 and 58: Table 40 TEA Grant Information is R
- Page 59 and 60: Overall Satisfaction with Informati
- Page 61 and 62: Table 43 Overall Satisfaction with
- Page 63 and 64: Table 45 Overall Satisfaction with
- Page 65 and 66: VI. TEA STRATEGIC PLANNING Table 47
- Page 67 and 68: VII. TEA WEBSITE Table 48 Visited T
- Page 69 and 70: Table 50 Visited TEA Website for As
- Page 71 and 72: Table 52 Visited TEA Website for Te
- Page 73 and 74: Table 54 Visited TEA Website for Da
- Page 75 and 76: Table 56 Visited TEA Website for Ed
- Page 77 and 78:
Table 58 Visited TEA Website for Sc
- Page 79 and 80:
Component Ratings Table 60 Easy to
- Page 81 and 82:
Table 62 Website Contains Clear Inf
- Page 83 and 84:
VIII. OVERALL SATISFACTION WITH TEA
- Page 85 and 86:
Table 66 Satisfaction with Standard
- Page 87 and 88:
Interventions and Special Investiga
- Page 89 and 90:
Strategy and Grants Management Tabl
- Page 91 and 92:
Commissioner Table 72 Satisfaction
- Page 93 and 94:
Agency Table 74 Overall Satisfactio
- Page 95 and 96:
Table 75 Overall Satisfaction with
- Page 97 and 98:
Table 77 Overall Satisfaction with
- Page 99 and 100:
IX. CONCLUSIONS The findings from t
- Page 101 and 102:
APPENDIX A: SURVEY INSTRUMENT Surve
- Page 103 and 104:
Infrastructure, Information Systems
- Page 105 and 106:
F. Overall Satisfaction I am satisf
- Page 107 and 108:
APPENDIX B: POLICY ISSUES Survey Re
- Page 109 and 110:
TEA Website As a grant accountant f
- Page 111 and 112:
Principals: Gifted and Talented Exi
- Page 113 and 114:
Too much testing. Observation Proto
- Page 115 and 116:
an equity issue in Texas and this i
- Page 117 and 118:
certification for this has been dis
- Page 119 and 120:
Special Education Testing State Man
- Page 121 and 122:
More funding for Alternative School
- Page 123 and 124:
nothing to entice new educators in
- Page 125 and 126:
Teacher Pay/ Benefits 747 5 Health
- Page 127 and 128:
Cutbacks to health insurance for te
- Page 129 and 130:
Insisting that all students be in g
- Page 131 and 132:
they can better serve the needs of
- Page 133 and 134:
I think we have to modify too much
- Page 135 and 136:
as the SAT/ACT and additional AP te
- Page 137 and 138:
and I feel that quality teaching ha
- Page 139 and 140:
ural and inner city schools without
- Page 141 and 142:
Teacher Pay/ Benefits Teacher Healt
- Page 143 and 144:
We need a TEA contact for librarian
- Page 145 and 146:
Accountability With the present acc
- Page 147 and 148:
Parental Involvement/ Responsibilit
- Page 149 and 150:
use them in the classroom! Not an e
- Page 151 and 152:
acceptance, we get students to the
- Page 153 and 154:
our district just robs us somewhere
- Page 155 and 156:
APPENDIX C: ADDITIONAL COMMENTS Sur
- Page 157 and 158:
number of people Please put back th
- Page 159 and 160:
demanding quality and accountabilit
- Page 161 and 162:
our needs. The feedback I gave you
- Page 163 and 164:
TEA - Unknowledgeable / Not Helpful
- Page 165 and 166:
Develop and implement accountabilit
- Page 167 and 168:
I was very disappointed that I neve
- Page 169 and 170:
solutions. I think Region 10 and TE
- Page 171 and 172:
It just seems that I have to wade t
- Page 173 and 174:
Info - More Accurate / Clear info,
- Page 175 and 176:
Testing Requirements The TAKS testi
- Page 177 and 178:
TEA - Not Effective / Unrealistic G
- Page 179 and 180:
have never happened if this monitor
- Page 181 and 182:
TEA must keep itself separate from
- Page 183:
esponsibilities, salaries, procedur


