2004 Customer Satisfaction Survey (PDF, 566 KB) - TEA - Home ...
2004 Customer Satisfaction Survey (PDF, 566 KB) - TEA - Home ...
2004 Customer Satisfaction Survey (PDF, 566 KB) - TEA - Home ...

Create successful ePaper yourself
Turn your PDF publications into a flip-book with our unique Google optimized e-Paper software.
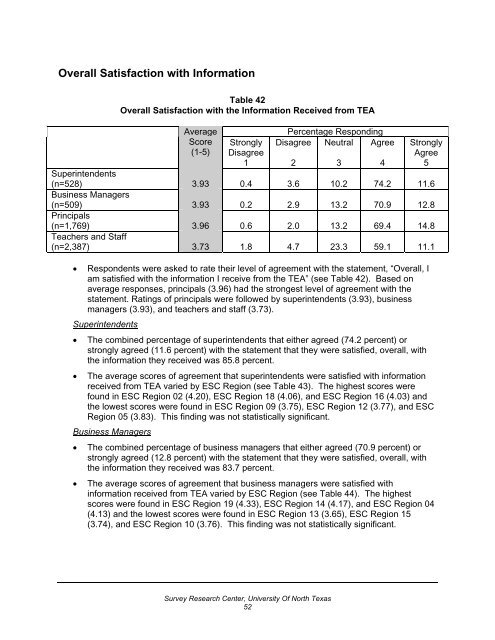
Overall <strong>Satisfaction</strong> with Information<br />
Table 42<br />
Overall <strong>Satisfaction</strong> with the Information Received from <strong>TEA</strong><br />
Average<br />
Score<br />
(1-5)<br />
Strongly<br />
Disagree<br />
1<br />
Percentage Responding<br />
Disagree Neutral Agree<br />
Strongly<br />
Agree<br />
5<br />
2 3 4<br />
Superintendents<br />
(n=528) 3.93 0.4 3.6 10.2 74.2 11.6<br />
Business Managers<br />
(n=509) 3.93 0.2 2.9 13.2 70.9 12.8<br />
Principals<br />
(n=1,769) 3.96 0.6 2.0 13.2 69.4 14.8<br />
Teachers and Staff<br />
(n=2,387) 3.73 1.8 4.7 23.3 59.1 11.1<br />
• Respondents were asked to rate their level of agreement with the statement, “Overall, I<br />
am satisfied with the information I receive from the <strong>TEA</strong>” (see Table 42). Based on<br />
average responses, principals (3.96) had the strongest level of agreement with the<br />
statement. Ratings of principals were followed by superintendents (3.93), business<br />
managers (3.93), and teachers and staff (3.73).<br />
Superintendents<br />
• The combined percentage of superintendents that either agreed (74.2 percent) or<br />
strongly agreed (11.6 percent) with the statement that they were satisfied, overall, with<br />
the information they received was 85.8 percent.<br />
• The average scores of agreement that superintendents were satisfied with information<br />
received from <strong>TEA</strong> varied by ESC Region (see Table 43). The highest scores were<br />
found in ESC Region 02 (4.20), ESC Region 18 (4.06), and ESC Region 16 (4.03) and<br />
the lowest scores were found in ESC Region 09 (3.75), ESC Region 12 (3.77), and ESC<br />
Region 05 (3.83). This finding was not statistically significant.<br />
Business Managers<br />
• The combined percentage of business managers that either agreed (70.9 percent) or<br />
strongly agreed (12.8 percent) with the statement that they were satisfied, overall, with<br />
the information they received was 83.7 percent.<br />
• The average scores of agreement that business managers were satisfied with<br />
information received from <strong>TEA</strong> varied by ESC Region (see Table 44). The highest<br />
scores were found in ESC Region 19 (4.33), ESC Region 14 (4.17), and ESC Region 04<br />
(4.13) and the lowest scores were found in ESC Region 13 (3.65), ESC Region 15<br />
(3.74), and ESC Region 10 (3.76). This finding was not statistically significant.<br />
<strong>Survey</strong> Research Center, University Of North Texas<br />
52