2004 Customer Satisfaction Survey (PDF, 566 KB) - TEA - Home ...
2004 Customer Satisfaction Survey (PDF, 566 KB) - TEA - Home ...
2004 Customer Satisfaction Survey (PDF, 566 KB) - TEA - Home ...

Create successful ePaper yourself
Turn your PDF publications into a flip-book with our unique Google optimized e-Paper software.
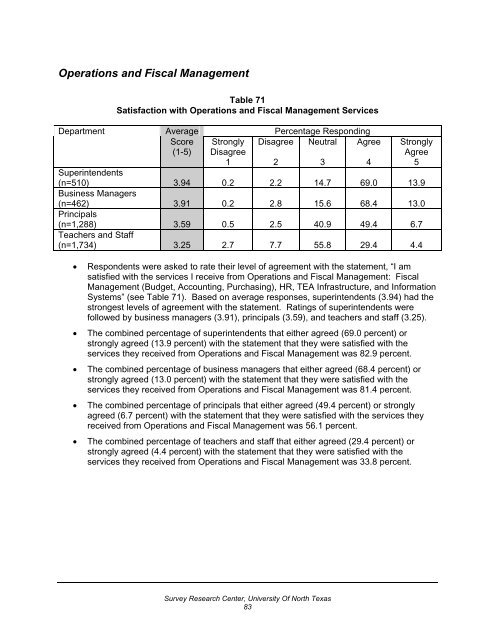
Operations and Fiscal Management<br />
Table 71<br />
<strong>Satisfaction</strong> with Operations and Fiscal Management Services<br />
Department Average Percentage Responding<br />
Score<br />
(1-5)<br />
Disagree Neutral Agree<br />
Strongly<br />
Disagree<br />
1<br />
Strongly<br />
Agree<br />
5<br />
2 3 4<br />
Superintendents<br />
(n=510) 3.94 0.2 2.2 14.7 69.0 13.9<br />
Business Managers<br />
(n=462) 3.91 0.2 2.8 15.6 68.4 13.0<br />
Principals<br />
(n=1,288) 3.59 0.5 2.5 40.9 49.4 6.7<br />
Teachers and Staff<br />
(n=1,734) 3.25 2.7 7.7 55.8 29.4 4.4<br />
• Respondents were asked to rate their level of agreement with the statement, “I am<br />
satisfied with the services I receive from Operations and Fiscal Management: Fiscal<br />
Management (Budget, Accounting, Purchasing), HR, <strong>TEA</strong> Infrastructure, and Information<br />
Systems” (see Table 71). Based on average responses, superintendents (3.94) had the<br />
strongest levels of agreement with the statement. Ratings of superintendents were<br />
followed by business managers (3.91), principals (3.59), and teachers and staff (3.25).<br />
• The combined percentage of superintendents that either agreed (69.0 percent) or<br />
strongly agreed (13.9 percent) with the statement that they were satisfied with the<br />
services they received from Operations and Fiscal Management was 82.9 percent.<br />
• The combined percentage of business managers that either agreed (68.4 percent) or<br />
strongly agreed (13.0 percent) with the statement that they were satisfied with the<br />
services they received from Operations and Fiscal Management was 81.4 percent.<br />
• The combined percentage of principals that either agreed (49.4 percent) or strongly<br />
agreed (6.7 percent) with the statement that they were satisfied with the services they<br />
received from Operations and Fiscal Management was 56.1 percent.<br />
• The combined percentage of teachers and staff that either agreed (29.4 percent) or<br />
strongly agreed (4.4 percent) with the statement that they were satisfied with the<br />
services they received from Operations and Fiscal Management was 33.8 percent.<br />
<strong>Survey</strong> Research Center, University Of North Texas<br />
83