2004 Customer Satisfaction Survey (PDF, 566 KB) - TEA - Home ...
2004 Customer Satisfaction Survey (PDF, 566 KB) - TEA - Home ...
2004 Customer Satisfaction Survey (PDF, 566 KB) - TEA - Home ...

You also want an ePaper? Increase the reach of your titles
YUMPU automatically turns print PDFs into web optimized ePapers that Google loves.
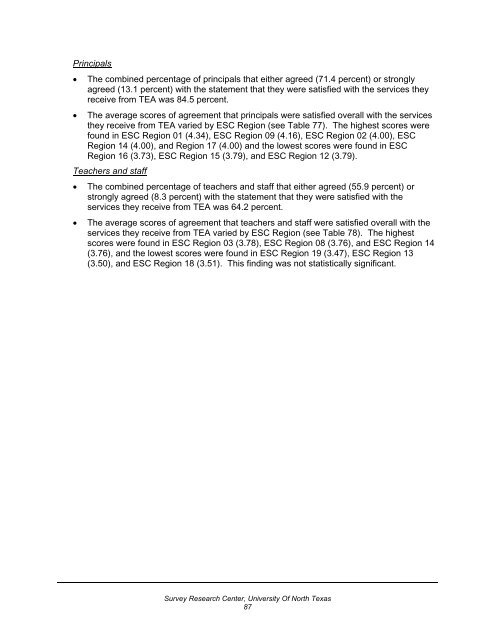
Principals<br />
• The combined percentage of principals that either agreed (71.4 percent) or strongly<br />
agreed (13.1 percent) with the statement that they were satisfied with the services they<br />
receive from <strong>TEA</strong> was 84.5 percent.<br />
• The average scores of agreement that principals were satisfied overall with the services<br />
they receive from <strong>TEA</strong> varied by ESC Region (see Table 77). The highest scores were<br />
found in ESC Region 01 (4.34), ESC Region 09 (4.16), ESC Region 02 (4.00), ESC<br />
Region 14 (4.00), and Region 17 (4.00) and the lowest scores were found in ESC<br />
Region 16 (3.73), ESC Region 15 (3.79), and ESC Region 12 (3.79).<br />
Teachers and staff<br />
• The combined percentage of teachers and staff that either agreed (55.9 percent) or<br />
strongly agreed (8.3 percent) with the statement that they were satisfied with the<br />
services they receive from <strong>TEA</strong> was 64.2 percent.<br />
• The average scores of agreement that teachers and staff were satisfied overall with the<br />
services they receive from <strong>TEA</strong> varied by ESC Region (see Table 78). The highest<br />
scores were found in ESC Region 03 (3.78), ESC Region 08 (3.76), and ESC Region 14<br />
(3.76), and the lowest scores were found in ESC Region 19 (3.47), ESC Region 13<br />
(3.50), and ESC Region 18 (3.51). This finding was not statistically significant.<br />
<strong>Survey</strong> Research Center, University Of North Texas<br />
87