2004 Customer Satisfaction Survey (PDF, 566 KB) - TEA - Home ...
2004 Customer Satisfaction Survey (PDF, 566 KB) - TEA - Home ...
2004 Customer Satisfaction Survey (PDF, 566 KB) - TEA - Home ...

Create successful ePaper yourself
Turn your PDF publications into a flip-book with our unique Google optimized e-Paper software.
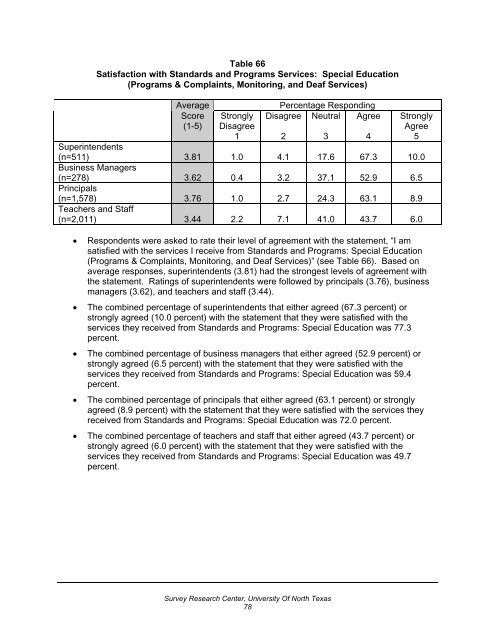
Table 66<br />
<strong>Satisfaction</strong> with Standards and Programs Services: Special Education<br />
(Programs & Complaints, Monitoring, and Deaf Services)<br />
Average<br />
Score<br />
(1-5)<br />
Strongly<br />
Disagree<br />
1<br />
Percentage Responding<br />
Disagree Neutral Agree<br />
Strongly<br />
Agree<br />
5<br />
2 3 4<br />
Superintendents<br />
(n=511) 3.81 1.0 4.1 17.6 67.3 10.0<br />
Business Managers<br />
(n=278) 3.62 0.4 3.2 37.1 52.9 6.5<br />
Principals<br />
(n=1,578) 3.76 1.0 2.7 24.3 63.1 8.9<br />
Teachers and Staff<br />
(n=2,011) 3.44 2.2 7.1 41.0 43.7 6.0<br />
• Respondents were asked to rate their level of agreement with the statement, “I am<br />
satisfied with the services I receive from Standards and Programs: Special Education<br />
(Programs & Complaints, Monitoring, and Deaf Services)” (see Table 66). Based on<br />
average responses, superintendents (3.81) had the strongest levels of agreement with<br />
the statement. Ratings of superintendents were followed by principals (3.76), business<br />
managers (3.62), and teachers and staff (3.44).<br />
• The combined percentage of superintendents that either agreed (67.3 percent) or<br />
strongly agreed (10.0 percent) with the statement that they were satisfied with the<br />
services they received from Standards and Programs: Special Education was 77.3<br />
percent.<br />
• The combined percentage of business managers that either agreed (52.9 percent) or<br />
strongly agreed (6.5 percent) with the statement that they were satisfied with the<br />
services they received from Standards and Programs: Special Education was 59.4<br />
percent.<br />
• The combined percentage of principals that either agreed (63.1 percent) or strongly<br />
agreed (8.9 percent) with the statement that they were satisfied with the services they<br />
received from Standards and Programs: Special Education was 72.0 percent.<br />
• The combined percentage of teachers and staff that either agreed (43.7 percent) or<br />
strongly agreed (6.0 percent) with the statement that they were satisfied with the<br />
services they received from Standards and Programs: Special Education was 49.7<br />
percent.<br />
<strong>Survey</strong> Research Center, University Of North Texas<br />
78