

bQNs7mR
bQNs7mR
bQNs7mR

You also want an ePaper? Increase the reach of your titles
YUMPU automatically turns print PDFs into web optimized ePapers that Google loves.
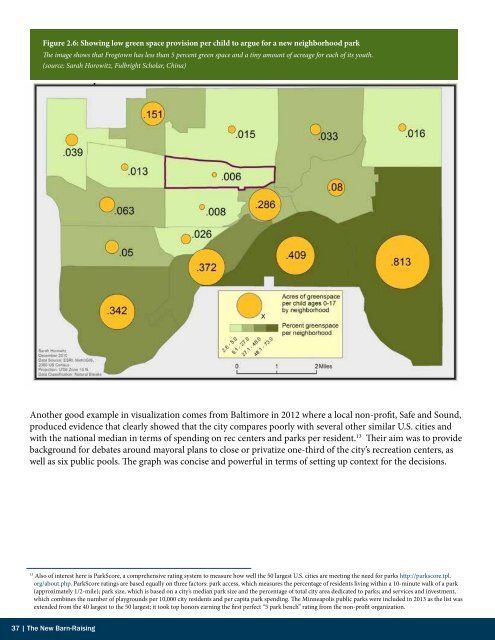
Figure 2.6: Showing low green space provision per child to argue for a new neighborhood park<br />
The image shows that Frogtown has less than 5 percent green space and a tiny amount of acreage for each of its youth.<br />
(source: Sarah Horowitz, Fulbright Scholar, China)<br />
Another good example in visualization comes from Baltimore in 2012 where a local non-profit, Safe and Sound,<br />
produced evidence that clearly showed that the city compares poorly with several other similar U.S. cities and<br />
with the national median in terms of spending on rec centers and parks per resident. 13 Their aim was to provide<br />
background for debates around mayoral plans to close or privatize one-third of the city’s recreation centers, as<br />
well as six public pools. The graph was concise and powerful in terms of setting up context for the decisions.<br />
13<br />
Also of interest here is ParkScore, a comprehensive rating system to measure how well the 50 largest U.S. cities are meeting the need for parks http://parkscore.tpl.<br />
org/about.php. ParkScore ratings are based equally on three factors: park access, which measures the percentage of residents living within a 10-minute walk of a park<br />
(approximately 1/2-mile); park size, which is based on a city’s median park size and the percentage of total city area dedicated to parks; and services and investment,<br />
which combines the number of playgrounds per 10,000 city residents and per capita park spending. The Minneapolis public parks were included in 2013 as the list was<br />
extended from the 40 largest to the 50 largest; it took top honors earning the first perfect “5 park bench” rating from the non-profit organization.<br />
37 | The New Barn-Raising