"Life Cycle" Hypothesis of Saving: Aggregate ... - Arabictrader.com
"Life Cycle" Hypothesis of Saving: Aggregate ... - Arabictrader.com
"Life Cycle" Hypothesis of Saving: Aggregate ... - Arabictrader.com
You also want an ePaper? Increase the reach of your titles
YUMPU automatically turns print PDFs into web optimized ePapers that Google loves.
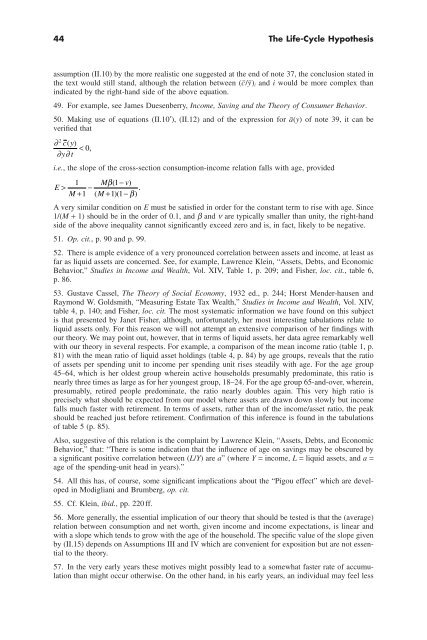
44 The <strong>Life</strong>-Cycle <strong>Hypothesis</strong><br />
assumption (II.10) by the more realistic one suggested at the end <strong>of</strong> note 37, the conclusion stated in<br />
the text would still stand, although the relation between (c¯/ȳ) i and i would be more <strong>com</strong>plex than<br />
indicated by the right-hand side <strong>of</strong> the above equation.<br />
49. For example, see James Duesenberry, In<strong>com</strong>e, <strong>Saving</strong> and the Theory <strong>of</strong> Consumer Behavior.<br />
50. Making use <strong>of</strong> equations (II.10¢), (II.12) and <strong>of</strong> the expression for ā(y) <strong>of</strong> note 39, it can be<br />
verified that<br />
2<br />
∂ cy ( ) < 0 ,<br />
∂y∂t<br />
i.e., the slope <strong>of</strong> the cross-section consumption-in<strong>com</strong>e relation falls with age, provided<br />
1 M v<br />
E > M + - b( 1-<br />
)<br />
1 ( M + 1) ( 1-<br />
b )<br />
.<br />
A very similar condition on E must be satisfied in order for the constant term to rise with age. Since<br />
1/(M + 1) should be in the order <strong>of</strong> 0.1, and b and n are typically smaller than unity, the right-hand<br />
side <strong>of</strong> the above inequality cannot significantly exceed zero and is, in fact, likely to be negative.<br />
51. Op. cit., p. 90 and p. 99.<br />
52. There is ample evidence <strong>of</strong> a very pronounced correlation between assets and in<strong>com</strong>e, at least as<br />
far as liquid assets are concerned. See, for example, Lawrence Klein, “Assets, Debts, and Economic<br />
Behavior,” Studies in In<strong>com</strong>e and Wealth, Vol. XIV, Table 1, p. 209; and Fisher, loc. cit., table 6,<br />
p. 86.<br />
53. Gustave Cassel, The Theory <strong>of</strong> Social Economy, 1932 ed., p. 244; Horst Mender-hausen and<br />
Raymond W. Goldsmith, “Measuring Estate Tax Wealth,” Studies in In<strong>com</strong>e and Wealth, Vol. XIV,<br />
table 4, p. 140; and Fisher, loc. cit. The most systematic information we have found on this subject<br />
is that presented by Janet Fisher, although, unfortunately, her most interesting tabulations relate to<br />
liquid assets only. For this reason we will not attempt an extensive <strong>com</strong>parison <strong>of</strong> her findings with<br />
our theory. We may point out, however, that in terms <strong>of</strong> liquid assets, her data agree remarkably well<br />
with our theory in several respects. For example, a <strong>com</strong>parison <strong>of</strong> the mean in<strong>com</strong>e ratio (table 1, p.<br />
81) with the mean ratio <strong>of</strong> liquid asset holdings (table 4, p. 84) by age groups, reveals that the ratio<br />
<strong>of</strong> assets per spending unit to in<strong>com</strong>e per spending unit rises steadily with age. For the age group<br />
45–64, which is her oldest group wherein active households presumably predominate, this ratio is<br />
nearly three times as large as for her youngest group, 18–24. For the age group 65-and-over, wherein,<br />
presumably, retired people predominate, the ratio nearly doubles again. This very high ratio is<br />
precisely what should be expected from our model where assets are drawn down slowly but in<strong>com</strong>e<br />
falls much faster with retirement. In terms <strong>of</strong> assets, rather than <strong>of</strong> the in<strong>com</strong>e/asset ratio, the peak<br />
should be reached just before retirement. Confirmation <strong>of</strong> this inference is found in the tabulations<br />
<strong>of</strong> table 5 (p. 85).<br />
Also, suggestive <strong>of</strong> this relation is the <strong>com</strong>plaint by Lawrence Klein, “Assets, Debts, and Economic<br />
Behavior,” that: “There is some indication that the influence <strong>of</strong> age on savings may be obscured by<br />
a significant positive correlation between (L/Y) are a” (where Y = in<strong>com</strong>e, L = liquid assets, and a =<br />
age <strong>of</strong> the spending-unit head in years).”<br />
54. All this has, <strong>of</strong> course, some significant implications about the “Pigou effect” which are developed<br />
in Modigliani and Brumberg, op. cit.<br />
55. Cf. Klein, ibid., pp. 220 ff.<br />
56. More generally, the essential implication <strong>of</strong> our theory that should be tested is that the (average)<br />
relation between consumption and net worth, given in<strong>com</strong>e and in<strong>com</strong>e expectations, is linear and<br />
with a slope which tends to grow with the age <strong>of</strong> the household. The specific value <strong>of</strong> the slope given<br />
by (II.15) depends on Assumptions III and IV which are convenient for exposition but are not essential<br />
to the theory.<br />
57. In the very early years these motives might possibly lead to a somewhat faster rate <strong>of</strong> accumulation<br />
than might occur otherwise. On the other hand, in his early years, an individual may feel less


