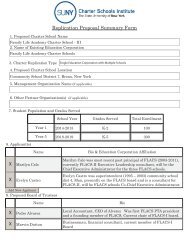
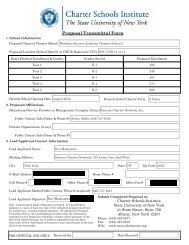
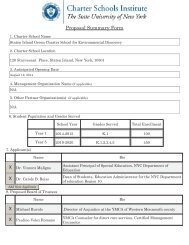
- Page 1 and 2:
TABLE OF CONTENTS Folder Name Trans
- Page 4 and 5:
Attachment B - Statistical Overview
- Page 6 and 7:
• Scope and sequence for each sub
- Page 8 and 9:
were 82 students on the Kindergarte
- Page 10 and 11:
D. RENEWAL QUESTION 1. IS THE SCHOO
- Page 12 and 13:
Class of 2024 (Kindergarten in 2007
- Page 14 and 15:
Measure II.B Each year, the school
- Page 16 and 17:
Class of 2022 (2 nd Grade in 07-08)
- Page 18 and 19:
Leadership Prep Bedford Stuyvesant
- Page 20 and 21:
IV. PEDAGOGY (BENCHMARK 1D) High qu
- Page 22 and 23:
Curriculum and Instruction or Dean
- Page 24 and 25:
Assessment Schedule Grade/Frequency
- Page 26 and 27:
Quarterly Performance Dashboard Stu
- Page 28 and 29:
Quarterly Performance Dashboard Gra
- Page 30 and 31:
Quarterly Performance Dashboard Gra
- Page 32 and 33:
Performance Dashboard - Inputs #1 D
- Page 34 and 35:
Performance Dashboard - Inputs #1 D
- Page 36 and 37:
Performance Dashboard - Inputs #2 5
- Page 38 and 39:
Performance Dashboard - Inputs #2 O
- Page 40 and 41:
Performance Dashboard - Inputs #2 A
- Page 42 and 43:
testament to the success of Leaders
- Page 44 and 45:
Family Survey Template 2007-2008 Pl
- Page 46 and 47:
Family Survey Results 2007-2008 A B
- Page 48 and 49:
Very Satified Somewhat Satisfied So
- Page 50 and 51:
Very Satified Somewhat Satisfied Qu
- Page 52 and 53:
Overall Grade of the School Ve ry S
- Page 54 and 55:
Ve ry Satified Somewhat Satisfied S
- Page 56 and 57:
Overall Grade of the School Very Sa
- Page 58 and 59:
Overall Grade of the School Satifie
- Page 60 and 61:
Ve ry Sa tified So mew hat Satisfie
- Page 62 and 63:
Overall Grade of the School Very Sa
- Page 64 and 65:
Quality of Academic Program 1 Acade
- Page 66 and 67:
Very Satified So me what Satisfied
- Page 68 and 69:
Quality of Academic Program 1 Acade
- Page 70 and 71:
Quality of Academic Program 1 Acade
- Page 72 and 73:
Quality of Academic Program 1 Acade
- Page 74 and 75:
Quality of Academic Program 1 Acade
- Page 76 and 77:
Quality of Academic Program 1 Acade
- Page 78 and 79:
Quality of Academic Program 1 Acade
- Page 80 and 81:
Quality of Academic Program 1 Acade
- Page 82 and 83:
Character development/education 1 U
- Page 84 and 85:
The teachers' accessibility by phon
- Page 86 and 87:
Overall Grade of the School 1 Quali
- Page 88 and 89:
School building facilities Characte
- Page 90 and 91:
Individual attention by teachers 1
- Page 92 and 93:
A B C Overall Grade of the School 1
- Page 94 and 95:
Behavorial standards and expectatio
- Page 96 and 97:
D Fail dissatisfied Very Dissatisfi
- Page 98 and 99:
D Fail dissatisfied Very Dissatisfi
- Page 100 and 101:
D Fail dissatisfied Very Dissatisfi
- Page 102 and 103:
D Fail dissatisfied Very Dissatisfi
- Page 104 and 105:
D Fail dissatisfied Very Dissatisfi
- Page 106 and 107:
D Fail Ve dissatisfied ry D issa ti
- Page 108 and 109:
D Fail dissatisfied Very D issa tis
- Page 110 and 111:
1 D 1 Fail dissatisfied Very Dis sa
- Page 112 and 113:
D Fail dissatisfied Very Dissa tisf
- Page 114 and 115:
D Fail Ve dissatisfied ry D issa ti
- Page 116 and 117:
D Fail dis Very satisfied Dis sati
- Page 118 and 119:
1 D Fail dissatisfied Very Dis sati
- Page 120 and 121:
D Fail Ve dissatisfied ry D issa ti
- Page 122 and 123:
D Fail di ssati Very Dis sfied sati
- Page 124 and 125:
D Fail dissatisfied Very Dis satis
- Page 126 and 127:
ied D Fail Ve dissatisf ry D issa t
- Page 128 and 129:
D Fail D Fail
- Page 130 and 131:
D Fail D Fail
- Page 132 and 133:
D Fail D Fail
- Page 134 and 135:
D Fail D Fail 1 1
- Page 136 and 137:
D Fail 1 1 D Fail
- Page 138 and 139:
D Fail
- Page 140 and 141:
D Fail D Fail
- Page 142 and 143:
Family Survey Results 2006-2007 LPC
- Page 144 and 145:
Family Survey Results 2006-2007 Sci
- Page 146 and 147:
Your child's acadmic progress 1 Fam
- Page 148 and 149:
Science instruction Overall Grade o
- Page 150 and 151:
School building facilities 1 Charac
- Page 152 and 153:
Quality of homework assigned 1 Quan
- Page 154 and 155:
Quality of the teachers 1 Your chil
- Page 156 and 157:
History/Social Studies 1 Science in
- Page 158 and 159:
The teachers' accessibility by phon
- Page 160 and 161:
Very Satified Quality of Academic P
- Page 162 and 163:
The school's mission 1 Behavorial s
- Page 164 and 165:
Quality of Academic Program 1 Acade
- Page 166 and 167:
Your child's acadmic progress 1 Fam
- Page 168 and 169:
Overall Grade of the School Quality
- Page 170 and 171:
Reading instruction 1 Writing instr
- Page 172 and 173:
Enrichment and extra-curricular act
- Page 174 and 175:
The teachers' accessibility by phon
- Page 176 and 177:
Math instruction History/Social Stu
- Page 178 and 179:
D Fail D Fail
- Page 180 and 181:
D Fail D Fail
- Page 182 and 183:
D Fail D Fail
- Page 184 and 185:
D Fail D Fail
- Page 186 and 187:
D Fail D Fail
- Page 188 and 189:
D Fail 1 D Fail 1
- Page 190 and 191:
D Fail D Fail
- Page 192 and 193:
D Fail dissatisfied Very Dissatisfi
- Page 194 and 195:
Very Satified Quality of Academic P
- Page 196 and 197:
The school's mission 1 Behavorial s
- Page 198 and 199:
The adminstrators' accessibility 1
- Page 200 and 201:
Quality of the teachers 1 Your chil
- Page 202 and 203:
Science instruction Overall Grade o
- Page 204 and 205:
Character development/education 1 U
- Page 206 and 207:
Class size 1 Fitness/P.E./Athletics
- Page 208:
Overall Grade of the School 14 10 1
- Page 211 and 212:
D Fail D Fail
- Page 213 and 214:
D Fail 1 1 D Fail
- Page 215 and 216:
D Fail D Fail
- Page 217 and 218:
D Fail
- Page 219 and 220:
D Fail D Fail
- Page 221 and 222:
D Fail D Fail
- Page 223 and 224:
D Fail dissatisfied D Very D issati
- Page 225 and 226:
LEADERSHIP PREP BEDFORD STUYVESANT
- Page 227 and 228:
LEADERSHIP PREP BEDFORD STUYVESANT
- Page 229 and 230:
LEADERSHIP PREP BEDFORD STUYVESANT
- Page 231 and 232:
LEADERSHIP PREP BEDFORD STUYVESANT
- Page 233 and 234:
LEADERSHIP PREP BEDFORD STUYVESANT
- Page 235 and 236:
LEADERSHIP PREP BEDFORD STUYVESANT
- Page 237 and 238:
LEADERSHIP PREP BEDFORD STUYVESANT
- Page 239 and 240:
LEADERSHIP PREP BEDFORD STUYVESANT
- Page 241 and 242:
LEADERSHIP PREP BEDFORD STUYVESANT
- Page 243 and 244:
F. RENEWAL QUESTION 3. IS THE SCHOO
- Page 245 and 246:
Result Leadership Preparatory Chart
- Page 247 and 248:
School Name: Leadership Preparatory
- Page 249 and 250:
LEADERSHIP PREP BEDFORD STUYVESANT
- Page 251 and 252:
LEADERSHIP PREP BEDFORD STUYVESANT
- Page 253 and 254:
Amended Attachment 4 - Term Indicat
- Page 291 and 292:
Attachment 12A - School Calendar Pr
- Page 293 and 294:
October 2008 (22 days of instructio
- Page 295 and 296:
February 2009 (14 days of instructi
- Page 297 and 298:
June 2009 (19 days of instruction)
- Page 299 and 300:
9 10 11 12 13 16 17 18 19 20 23 24
- Page 301 and 302:
April 2010 (16 days of instruction)
- Page 303 and 304:
September 2010 (21 days of instruct
- Page 305 and 306:
24 25 26 27 28 31 February 2011 (14
- Page 307 and 308:
June 2011 (18 days of instruction)
- Page 309 and 310:
When students are in school, we bel
- Page 311 and 312:
Attachment 15B - School Developed A
- Page 313 and 314:
• To identify the need for interv
- Page 315 and 316:
Brooklyn, NY 11216 Cellular Telepho
- Page 317 and 318:
Attachment 29 - Organizational Char
- Page 319 and 320:
To the extent a vacant space is ava
- Page 321 and 322:
• The applicant’s family is enr
- Page 323 and 324:
Attachment 32 - Discipline Rules an
- Page 325 and 326:
Most Serious: • Sexual / racial /
- Page 327 and 328:
1.3. Failing to Complete Homework:
- Page 329 and 330:
not commit harassment, which includ
- Page 331 and 332:
with the decision of the Instructio
- Page 333 and 334:
The policy applicable to the releas
- Page 335 and 336:
Director shall not be appointed as
- Page 337 and 338:
• OTHER LOGOS: No logos, emblems,
- Page 339 and 340:
Attachment 33 - Discipline Policy f
- Page 341 and 342:
Attachment 36 - Plan for Health Ser
- Page 343 and 344:
Attachment 37 - Freedom of Informat
- Page 345 and 346:
Attachment 38 - Open Meetings Law P
- Page 347 and 348:
Attachment 39 - Complaints Policy A
- Page 349 and 350:
Attachment 40 - Dissolution of Char
- Page 351 and 352:
Schedule of Insurance LEADERSHIP PR
- Page 353 and 354: Attachment 53 - Facility Layout If
- Page 355 and 356: Leadership Prep Bedford Stuyvesant
- Page 357 and 358: Exhibit 5 - Board of Trustees Organ
- Page 359 and 360: Exhibit 7 - Facility Layout Leaders
- Page 361 and 362: ACCOUNTABILITY PLAN FOR THE CHARTER
- Page 363 and 364: Goal: Students will demonstrate pro
- Page 365 and 366: New York State Content Standards (c
- Page 367 and 368: New York State Content Standards St
- Page 369 and 370: New York State Content Standards St
- Page 371 and 372: New York State Content Standards (c
- Page 373 and 374: New York State Content Standards St
- Page 375 and 376: New York State Content Standards St
- Page 377 and 378: New York State Content Standards St
- Page 379 and 380: New York State Content Standards St
- Page 381 and 382: New York State Content Standards St
- Page 383 and 384: Subject Area: Mathematics Grade Lev
- Page 385 and 386: Subject Area: Mathematics Grade Lev
- Page 387 and 388: Subject Area: Mathematics Grade Lev
- Page 389 and 390: Subject Area: Mathematics Grade Lev
- Page 391 and 392: Subject Area: Mathematics Grade Lev
- Page 393 and 394: Subject Area: Mathematics Grade Lev
- Page 395 and 396: Subject Area: Mathematics Grade Lev
- Page 397 and 398: Subject Area: Mathematics Grade Lev
- Page 399 and 400: Subject Area: Mathematics Grade Lev
- Page 401 and 402: Subject Area: Science Grade Level:
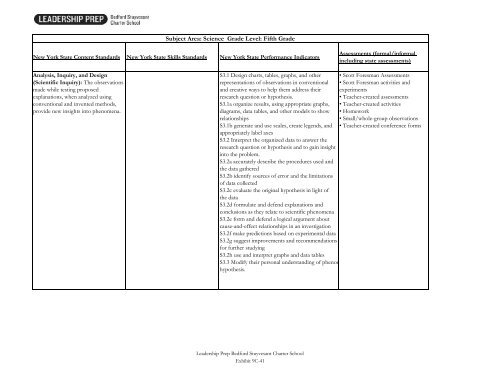
- Page 403: Subject Area: Science Grade Level:
- Page 407 and 408: Subject Area: Science Grade Level:
- Page 409 and 410: Subject Area: Science Grade Level:
- Page 411 and 412: Subject Area: Science Grade Level:
- Page 413 and 414: Subject Area: Science Grade Level:
- Page 415 and 416: Subject Area: Science Grade Level:
- Page 417 and 418: Subject Area: Science Grade Level:
- Page 419 and 420: Subject Area: Science Grade Level:
- Page 421 and 422: Subject Area: Science Grade Level:
- Page 423 and 424: Subject Area: Science Grade Level:
- Page 425 and 426: Subject Area: Science Grade Level:
- Page 427 and 428: Subject Area: Science Grade Level:
- Page 429 and 430: Subject Area: Science Grade Level:
- Page 431 and 432: Subject Area: Science Grade Level:
- Page 433 and 434: Subject Area: Science Grade Level:
- Page 435 and 436: Subject Area: Science Grade Level:
- Page 437 and 438: Subject Area: Social Studies Grade
- Page 439 and 440: Subject Area: Social Studies Grade
- Page 441 and 442: Subject Area: Social Studies Grade
- Page 443 and 444: Subject Area: Social Studies Grade
- Page 445 and 446: Subject Area: Social Studies Grade
- Page 447 and 448: Subject Area: Social Studies Grade
- Page 449: Subject Area: Social Studies Grade