- Page 1 and 2:
The Disproportionate Overrepresenta
- Page 3 and 4:
The Disproportionate Overrepresenta
- Page 5 and 6:
Each of the following persons, in a
- Page 7 and 8:
Race Differences in Processing…
- Page 9 and 10:
Future Opportunities……………
- Page 11 and 12:
Crimes………………………
- Page 13 and 14:
LIST OF TABLES Title Page # Summary
- Page 15 and 16:
Frequency Distributions of Variable
- Page 17 and 18:
Definition of Variables Used to Rep
- Page 19 and 20:
Frequency Distributions of Variable
- Page 21 and 22:
Definitions of Variables Used to Re
- Page 23 and 24:
Research Sites 2 Due to the relativ
- Page 25 and 26:
was counted as only one referral. T
- Page 27 and 28:
6 result of an active policy which
- Page 29 and 30:
8 outcomes is as follows: adjudicat
- Page 31 and 32:
10 Analysis The analyses followed t
- Page 33 and 34:
12 Scott County: At the stage of pe
- Page 35 and 36:
14 Table 1. Summary of Research Des
- Page 37 and 38:
16 Table 1-continued. _____________
- Page 39 and 40:
18 Table 2--Continued. Black Hawk W
- Page 41 and 42:
Table 3.-continued. 20 Disposition
- Page 43 and 44:
Table 3.-continued. 22 Disposition
- Page 45 and 46:
24 objective of this approach was t
- Page 47 and 48:
26 negative light, represented by b
- Page 49 and 50:
28 Thus, the decision makers respon
- Page 51 and 52:
30 specific county is first present
- Page 53 and 54:
Table 1. Number of Self-Reports and
- Page 55 and 56:
34 in interacting with youth. The e
- Page 57 and 58:
36 end up being good and I learned
- Page 59 and 60:
38 he is on probation, he knows the
- Page 61 and 62:
40 . . . level of supervision and a
- Page 63 and 64:
42 For the young black man it is a
- Page 65 and 66:
44 (47 percent answered most of the
- Page 67 and 68:
46 the result of disproportionate i
- Page 69 and 70:
48 court whereas a person without t
- Page 71 and 72:
50 and deprivation financially and
- Page 73 and 74:
52 referred on to petition. The res
- Page 75 and 76:
Blacks/Dropout Placement 54 The sec
- Page 77 and 78:
56 of things doesn’t get arrested
- Page 79 and 80:
58 I think that traditionally Black
- Page 81 and 82:
60 while job and they are contribut
- Page 83 and 84:
62 be. If someone has done wrong an
- Page 85 and 86:
64 also varied. The two more promin
- Page 87 and 88:
66 Table 2. Definition of Variables
- Page 89 and 90:
Table 3--continued. 68 Variable Nam
- Page 91 and 92:
70 Table 4. Definition of Variables
- Page 93 and 94:
Table 5--continued. 72 Variable Nam
- Page 95 and 96:
Table 5--continued. Variable Name C
- Page 97 and 98:
76 Table 7. Frequency Distributions
- Page 99 and 100:
78 Table 8. Definition of Variables
- Page 101 and 102:
Table 10. Definition of Variable Re
- Page 103 and 104:
Table 11--continued. Variable Name
- Page 105 and 106:
84 Several black youth felt that wh
- Page 107 and 108:
86 Some individuals did believe tha
- Page 109 and 110:
88 In summary both races felt that
- Page 111 and 112:
90 A black male reasoned that black
- Page 113 and 114:
92 variation in the responses. A ma
- Page 115 and 116:
94 than white. Almost all of t blac
- Page 117 and 118:
96 for a probation violation.” A
- Page 119 and 120:
98 get to associate with kids and h
- Page 121 and 122:
100 “It’s too hard for me. I do
- Page 123 and 124:
102 married or nothing like that.
- Page 125 and 126:
104 Table 1. Definition of Variable
- Page 127 and 128:
Table 2--continued. White Black Var
- Page 129 and 130:
108 Table 4. Frequency Distribution
- Page 131 and 132:
110 Table 4--continued. White Black
- Page 133 and 134:
112 Table 5. Definition of Variable
- Page 135 and 136:
114 Table 6--continued. White Black
- Page 137 and 138:
116 Table 7. Definition of Variable
- Page 139 and 140:
118 Table 8--continued. White Black
- Page 141 and 142:
120 more diversified personnel to a
- Page 143 and 144:
122 I have problems with the facili
- Page 145 and 146:
124 adhere to, you know, to the cou
- Page 147 and 148:
126 laymen, lay people the authorit
- Page 149 and 150:
128 called an original gang member.
- Page 151 and 152:
opportunity, or do you wait for the
- Page 153 and 154:
132 ...there’s things that you di
- Page 155 and 156:
134 almost never/never). Thirty-fou
- Page 157 and 158:
136 I think that may be apart of it
- Page 159 and 160:
138 one-time meeting with this fami
- Page 161 and 162:
140 …no differences. I don’t th
- Page 163 and 164:
142 of our diversion programs as qu
- Page 165 and 166:
144 Q. As an excuse for why they co
- Page 167 and 168:
146 blacks were released while olde
- Page 169 and 170:
148 not be cooperative, it limits y
- Page 171 and 172:
150 Indian Youth of America is very
- Page 173 and 174:
Blacks, Native American Indians Les
- Page 175 and 176:
154 Overall, most of the decision m
- Page 177 and 178:
156 same schools in Sioux City. The
- Page 179 and 180:
158 A. Well, they’re living in Si
- Page 181 and 182:
160 A. Yeah, I think so. I think th
- Page 183 and 184:
162 ideological position is evident
- Page 185 and 186:
Table 1. Distributions of Decision
- Page 187 and 188:
166 Table 3. Frequency Distribution
- Page 189 and 190:
Table 3--continued 168 Variable Nam
- Page 191 and 192:
170 Table 5. Frequency Distribution
- Page 193 and 194: Table 5-continued. 172 Variable Nam
- Page 195 and 196: 174 Table 7. Frequency Distribution
- Page 197 and 198: Table 8. Definition of Variables Re
- Page 199 and 200: Table 10. Definition of Variables R
- Page 201 and 202: Table 11-continued. 178 Variable Na
- Page 203 and 204: Chapter Six Woodbury County Youth T
- Page 205 and 206: 182 Q: Do you feel racial discrimin
- Page 207 and 208: improving. There was one twelve yea
- Page 209 and 210: 186 Q: Do you feel racial discrimin
- Page 211 and 212: 188 Q: Do you feel that a black per
- Page 213 and 214: 190 In the interviews, half of the
- Page 215 and 216: 192 Trust The question asked in thi
- Page 217 and 218: 194 According to the Hispanic youth
- Page 219 and 220: 196 he always yells at the black ki
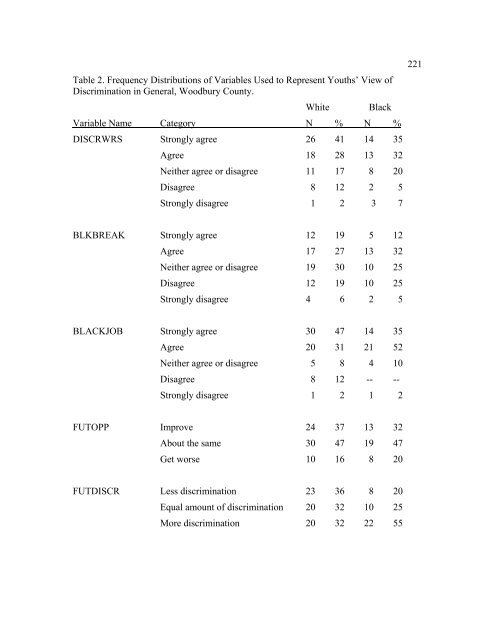
- Page 221 and 222: (58 percent of the whites, 55 perce
- Page 223 and 224: 200 Q: Now, tell me why. A: Cause i
- Page 225 and 226: 202 Q: You mean of physical harm or
- Page 227 and 228: 204 have a lot of respect for the p
- Page 229 and 230: Perceptions of Probation Officers 2
- Page 231 and 232: 208 blacks (Tables 5, 6). Generally
- Page 233 and 234: 210 Black youth He’s nice. He tal
- Page 235 and 236: 212 The first black youth believed
- Page 237 and 238: 214 because the teacher would not l
- Page 239 and 240: 216 and go to the principal’s off
- Page 241 and 242: 218 The youth have taken into consi
- Page 243: 220 Table 1. Definition of Variable
- Page 247 and 248: 224 Table 4. Frequency Distribution
- Page 249 and 250: 226 Table 4-continued White Black V
- Page 251 and 252: 228 Table 5. Definition of Variable
- Page 253 and 254: 230 Table 6-continued. White Black
- Page 255 and 256: 232 Table 7. Definition of Variable
- Page 257 and 258: 234 Table 8--continued. White Black
- Page 259 and 260: 236 Perceived Role of the Court and
- Page 261 and 262: 238 There is extremely more paperwo
- Page 263 and 264: As in the responses to the closed e
- Page 265 and 266: 242 getting the support from the pa
- Page 267 and 268: 244 They seem to want to turn the k
- Page 269 and 270: 246 crime. There are some officers,
- Page 271 and 272: Police 248 In response to the close
- Page 273 and 274: 250 tend to be drawn to gang activi
- Page 275 and 276: 252 Blacks and Detention The first
- Page 277 and 278: 254 The problem is availability. Th
- Page 279 and 280: 256 the percentages. I don’t know
- Page 281 and 282: 258 Table 1. Distributions of Decis
- Page 283 and 284: 260 Table 3. Frequency Distribution
- Page 285 and 286: Table 3-continued. 262 Variable Nam
- Page 287 and 288: 264 Table 5. Frequency Distribution
- Page 289 and 290: Table 5-continued. 266 Variable Nam
- Page 291 and 292: Table 6. Definition of Variables Re
- Page 293 and 294: Table 7-continued. 270 Variable Nam
- Page 295 and 296:
272 Table 9. Frequency Distribution
- Page 297 and 298:
274 Table 11. Frequency Distributio
- Page 299 and 300:
Chapter Eight YOUTH POLK COUNTY The
- Page 301 and 302:
278 ...because of the last past thi
- Page 303 and 304:
280 equal opportunity; yet, youth w
- Page 305 and 306:
282 The trend in the interviews, fo
- Page 307 and 308:
284 in the minority. Racism is indi
- Page 309 and 310:
286 could single out a group that t
- Page 311 and 312:
288 I think it is because they are
- Page 313 and 314:
290 could trust the police, there w
- Page 315 and 316:
292 View of Probation Officer In th
- Page 317 and 318:
294 and he spoke out against me, ma
- Page 319 and 320:
296 Some of those blacks who did co
- Page 321 and 322:
Summary 298 In general, most of the
- Page 323 and 324:
300 Table 2. Frequency Distribution
- Page 325 and 326:
302 Table 3. Definition of Variable
- Page 327 and 328:
304 Table 4-continued. White Black
- Page 329 and 330:
Table 4-continued. White Black Vari
- Page 331 and 332:
308 Table 6. Frequency Distribution
- Page 333 and 334:
310 Table 6-continued. White Black
- Page 335 and 336:
312 Table 8. Frequency Distribution
- Page 337 and 338:
Charter Nine Adult Decision Makers
- Page 339 and 340:
316 from becoming recidivists and
- Page 341 and 342:
318 The paperwork. I think I do my
- Page 343 and 344:
320 By reading through the intervie
- Page 345 and 346:
322 difference is that youth are no
- Page 347 and 348:
324 this country. I don’t think i
- Page 349 and 350:
326 I think some of them have to pr
- Page 351 and 352:
328 I think they’re about the sam
- Page 353 and 354:
330 My feeling is that the most com
- Page 355 and 356:
332 The Juvenile Justice System In
- Page 357 and 358:
334 I have seen a couple of instanc
- Page 359 and 360:
336 The Disproportionate Overrepres
- Page 361 and 362:
338 It just goes to show that is al
- Page 363 and 364:
340 Race Findings Specific to Study
- Page 365 and 366:
342 Blacks Receive Consent Decrees
- Page 367 and 368:
344 small minority we are dealing w
- Page 369 and 370:
346 In response to the second phase
- Page 371 and 372:
348 As a person who hires here, I a
- Page 373 and 374:
350 Table 1. Distributions of Decis
- Page 375 and 376:
352 Table 3. Frequency Distribution
- Page 377 and 378:
354 Table 3-continued. Variable Nam
- Page 379 and 380:
356 Table 5. Frequency Distribution
- Page 381 and 382:
Table 5-continued. 358 Variable Nam
- Page 383 and 384:
Table 6. Definition of Variable Rep
- Page 385 and 386:
Table 7-continued. 362 Variable Nam
- Page 387 and 388:
364 Table 9. Frequency Distribution
- Page 389 and 390:
366 Table 11. Frequency Distributio
- Page 391 and 392:
Chapter Ten Youth Scott County Ther
- Page 393 and 394:
370 have equal job opportunities (6
- Page 395 and 396:
372 concerning opportunities in the
- Page 397 and 398:
374 police brutality. One expressed
- Page 399 and 400:
376 feel police do not treat everyo
- Page 401 and 402:
378 just thinks you’re never goin
- Page 403 and 404:
380 The results from the self repor
- Page 405 and 406:
382 white youth who reported he wou
- Page 407 and 408:
384 When asked whether they regrett
- Page 409 and 410:
386 Table 1. Definition of Variable
- Page 411 and 412:
388 Table 2-continued. White Black
- Page 413 and 414:
390 Table 4. Frequency Distribution
- Page 415 and 416:
392 Table 4-continued. White Black
- Page 417 and 418:
394 Table 5. Definition of Variable
- Page 419 and 420:
396 Table 6-continued. White Black
- Page 421 and 422:
398 Table 7. Definition of Variable
- Page 423 and 424:
400 Table 8-continued White Black V
- Page 425 and 426:
402 asked more general questions th
- Page 427 and 428:
404 however, were the dominant them
- Page 429 and 430:
406 In all four counties, decision
- Page 431 and 432:
408 Recommendations A number of rec
- Page 433 and 434:
410 encourage sexual promiscuity, a
- Page 435 and 436:
412 decision makers have little exp
- Page 437 and 438:
414 resources and rising expectatio
- Page 439 and 440:
416 Depending on the county, decisi
- Page 441 and 442:
418 family cooperativeness or defic
- Page 443 and 444:
420 Table 1. Summary of Themes and
- Page 445 and 446:
422 Explanations of Specific Findin
- Page 447:
BIBLIOGRAPHY Bishop, D. and C. Fraz


![Chapter 5 [PDF] - Office of Juvenile Justice and Delinquency ...](https://img.yumpu.com/46584340/1/190x245/chapter-5-pdf-office-of-juvenile-justice-and-delinquency-.jpg?quality=85)