Floyd County Thoroughfare Plan - Floyd County Indiana - State of ...
Floyd County Thoroughfare Plan - Floyd County Indiana - State of ...
Floyd County Thoroughfare Plan - Floyd County Indiana - State of ...

You also want an ePaper? Increase the reach of your titles
YUMPU automatically turns print PDFs into web optimized ePapers that Google loves.
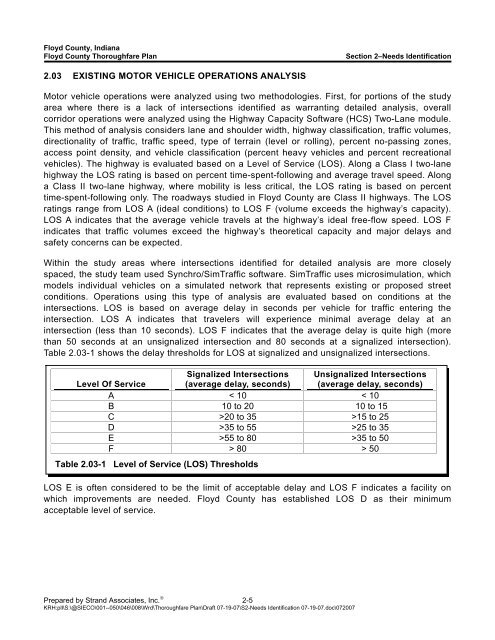
<strong>Floyd</strong> <strong>County</strong>, <strong>Indiana</strong><strong>Floyd</strong> <strong>County</strong> <strong>Thoroughfare</strong> <strong>Plan</strong>Section 2–Needs Identification2.03 EXISTING MOTOR VEHICLE OPERATIONS ANALYSISMotor vehicle operations were analyzed using two methodologies. First, for portions <strong>of</strong> the studyarea where there is a lack <strong>of</strong> intersections identified as warranting detailed analysis, overallcorridor operations were analyzed using the Highway Capacity S<strong>of</strong>tware (HCS) Two-Lane module.This method <strong>of</strong> analysis considers lane and shoulder width, highway classification, traffic volumes,directionality <strong>of</strong> traffic, traffic speed, type <strong>of</strong> terrain (level or rolling), percent no-passing zones,access point density, and vehicle classification (percent heavy vehicles and percent recreationalvehicles). The highway is evaluated based on a Level <strong>of</strong> Service (LOS). Along a Class I two-lanehighway the LOS rating is based on percent time-spent-following and average travel speed. Alonga Class II two-lane highway, where mobility is less critical, the LOS rating is based on percenttime-spent-following only. The roadways studied in <strong>Floyd</strong> <strong>County</strong> are Class II highways. The LOSratings range from LOS A (ideal conditions) to LOS F (volume exceeds the highway’s capacity).LOS A indicates that the average vehicle travels at the highway’s ideal free-flow speed. LOS Findicates that traffic volumes exceed the highway’s theoretical capacity and major delays andsafety concerns can be expected.Within the study areas where intersections identified for detailed analysis are more closelyspaced, the study team used Synchro/SimTraffic s<strong>of</strong>tware. SimTraffic uses microsimulation, whichmodels individual vehicles on a simulated network that represents existing or proposed streetconditions. Operations using this type <strong>of</strong> analysis are evaluated based on conditions at theintersections. LOS is based on average delay in seconds per vehicle for traffic entering theintersection. LOS A indicates that travelers will experience minimal average delay at anintersection (less than 10 seconds). LOS F indicates that the average delay is quite high (morethan 50 seconds at an unsignalized intersection and 80 seconds at a signalized intersection).Table 2.03-1 shows the delay thresholds for LOS at signalized and unsignalized intersections.Level Of ServiceSignalized Intersections(average delay, seconds)Unsignalized Intersections(average delay, seconds)A < 10 < 10B 10 to 20 10 to 15C >20 to 35 >15 to 25D >35 to 55 >25 to 35E >55 to 80 >35 to 50F > 80 > 50Table 2.03-1 Level <strong>of</strong> Service (LOS) ThresholdsLOS E is <strong>of</strong>ten considered to be the limit <strong>of</strong> acceptable delay and LOS F indicates a facility onwhich improvements are needed. <strong>Floyd</strong> <strong>County</strong> has established LOS D as their minimumacceptable level <strong>of</strong> service.Prepared by Strand Associates, Inc. ® 2-5KRH:pll\S:\@SIECO\001--050\046\008\Wrd\<strong>Thoroughfare</strong> <strong>Plan</strong>\Draft 07-19-07\S2-Needs Identification 07-19-07.doc\072007