


Create successful ePaper yourself
Turn your PDF publications into a flip-book with our unique Google optimized e-Paper software.
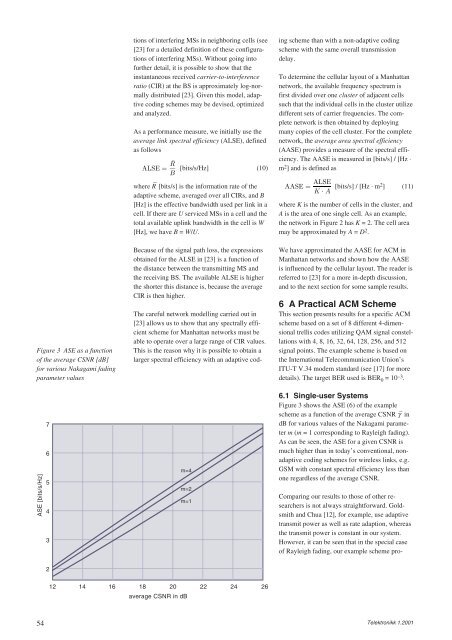
Figure 3 ASE as a function<br />
of the average CSNR [dB]<br />
for various Nakagami fading<br />
parameter values<br />
ASE [bits/s/Hz]<br />
54<br />
7<br />
6<br />
5<br />
4<br />
3<br />
2<br />
12<br />
tions of interfering MSs in neighboring cells (see<br />
[23] for a detailed definition of these configurations<br />
of interfering MSs). Without going into<br />
further detail, it is possible to show that the<br />
instantaneous received carrier-to-interference<br />
ratio (CIR) at the BS is approximately log-normally<br />
distributed [23]. Given this model, adaptive<br />
coding schemes may be devised, optimized<br />
and analyzed.<br />
As a performance measure, we initially use the<br />
average link spectral efficiency (ALSE), defined<br />
as follows<br />
[bits/s/Hz] (10)<br />
where R – ALSE =<br />
[bits/s] is the information rate of the<br />
adaptive scheme, averaged over all CIRs, and B<br />
[Hz] is the effective bandwidth used per link in a<br />
cell. If there are U serviced MSs in a cell and the<br />
total available uplink bandwidth in the cell is W<br />
[Hz], we have B = W/U.<br />
¯ R<br />
B<br />
Because of the signal path loss, the expressions<br />
obtained for the ALSE in [23] is a function of<br />
the distance between the transmitting MS and<br />
the receiving BS. The available ALSE is higher<br />
the shorter this distance is, because the average<br />
CIR is then higher.<br />
The careful network modelling carried out in<br />
[23] allows us to show that any spectrally efficient<br />
scheme for Manhattan networks must be<br />
able to operate over a large range of CIR values.<br />
This is the reason why it is possible to obtain a<br />
larger spectral efficiency with an adaptive cod-<br />
m=4<br />
m=2<br />
m=1<br />
14 16 18 20 22 24 26<br />
average CSNR in dB<br />
ing scheme than with a non-adaptive coding<br />
scheme with the same overall transmission<br />
delay.<br />
To determine the cellular layout of a Manhattan<br />
network, the available frequency spectrum is<br />
first divided over one cluster of adjacent cells<br />
such that the individual cells in the cluster utilize<br />
different sets of carrier frequencies. The complete<br />
network is then obtained by deploying<br />
many copies of the cell cluster. For the complete<br />
network, the average area spectral efficiency<br />
(AASE) provides a measure of the spectral efficiency.<br />
The AASE is measured in [bits/s] / [Hz ⋅<br />
m2 ] and is defined as<br />
[bits/s] / [Hz . m2 ] (11)<br />
where K is the number of cells in the cluster, and<br />
A is the area of one single cell. As an example,<br />
the network in Figure 2 has K = 2. The cell area<br />
may be approximated by A = D2 AASE =<br />
.<br />
ALSE<br />
K · A<br />
We have approximated the AASE for ACM in<br />
Manhattan networks and shown how the AASE<br />
is influenced by the cellular layout. The reader is<br />
referred to [23] for a more in-depth discussion,<br />
and to the next section for some sample results.<br />
6 A Practical ACM Scheme<br />
This section presents results for a specific ACM<br />
scheme based on a set of 8 different 4-dimensional<br />
trellis codes utilizing QAM signal constellations<br />
with 4, 8, 16, 32, 64, 128, 256, and 512<br />
signal points. The example scheme is based on<br />
the International Telecommunication Union’s<br />
ITU-T V.34 modem standard (see [17] for more<br />
details). The target BER used is BER 0 = 10 –3 .<br />
6.1 Single-user Systems<br />
Figure 3 shows the ASE (6) of the example<br />
scheme as a function of the average CSNR γ – in<br />
dB for various values of the Nakagami parameter<br />
m (m = 1 corresponding to Rayleigh fading).<br />
As can be seen, the ASE for a given CSNR is<br />
much higher than in today’s conventional, nonadaptive<br />
coding schemes for wireless links, e.g.<br />
GSM with constant spectral efficiency less than<br />
one regardless of the average CSNR.<br />
Comparing our results to those of other researchers<br />
is not always straightforward. Goldsmith<br />
and Chua [12], for example, use adaptive<br />
transmit power as well as rate adaption, whereas<br />
the transmit power is constant in our system.<br />
However, it can be seen that in the special case<br />
of Rayleigh fading, our example scheme pro-<br />
Telektronikk 1.2001


