


Create successful ePaper yourself
Turn your PDF publications into a flip-book with our unique Google optimized e-Paper software.
vides an ASE increase of about 0.5 bits/s/Hz<br />
compared to the uncoded, constant-power, rateadaptive<br />
QAM scheme of Alouini and Goldsmith<br />
[11]. Furthermore, comparing with the<br />
expression in (5) we find that the difference<br />
between the MASE and ASE of our example<br />
scheme is less than 1.9 bits/s/Hz [17].<br />
6.2 Cellular Systems<br />
Consider the link between an MS, called the<br />
desired MS, and its BS in the Manhattan network<br />
model. The other transmitting MSs in the<br />
fully-loaded network are the interfering MSs.<br />
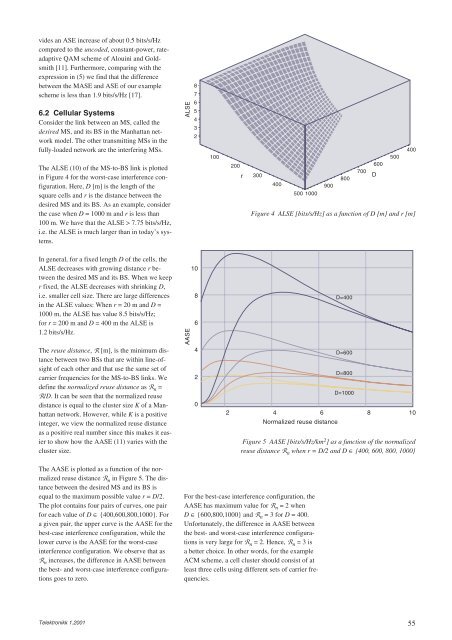
The ALSE (10) of the MS-to-BS link is plotted<br />
in Figure 4 for the worst-case interference configuration.<br />
Here, D [m] is the length of the<br />
square cells and r is the distance between the<br />
desired MS and its BS. As an example, consider<br />
the case when D = 1000 m and r is less than<br />
100 m. We have that the ALSE > 7.75 bits/s/Hz,<br />
i.e. the ALSE is much larger than in today’s systems.<br />
In general, for a fixed length D of the cells, the<br />
ALSE decreases with growing distance r between<br />
the desired MS and its BS. When we keep<br />
r fixed, the ALSE decreases with shrinking D,<br />
i.e. smaller cell size. There are large differences<br />
in the ALSE values: When r = 20 m and D =<br />
1000 m, the ALSE has value 8.5 bits/s/Hz;<br />
for r = 200 m and D = 400 m the ALSE is<br />
1.2 bits/s/Hz.<br />
The reuse distance, R [m], is the minimum distance<br />
between two BSs that are within line-ofsight<br />
of each other and that use the same set of<br />
carrier frequencies for the MS-to-BS links. We<br />
define the normalized reuse distance as R n =<br />
R/D. It can be seen that the normalized reuse<br />
distance is equal to the cluster size K of a Manhattan<br />
network. However, while K is a positive<br />
integer, we view the normalized reuse distance<br />
as a positive real number since this makes it easier<br />
to show how the AASE (11) varies with the<br />
cluster size.<br />
The AASE is plotted as a function of the normalized<br />
reuse distance R n in Figure 5. The distance<br />
between the desired MS and its BS is<br />
equal to the maximum possible value r = D/2.<br />
The plot contains four pairs of curves, one pair<br />
for each value of D ∈ {400,600,800,1000}. For<br />
a given pair, the upper curve is the AASE for the<br />
best-case interference configuration, while the<br />
lower curve is the AASE for the worst-case<br />
interference configuration. We observe that as<br />
R n increases, the difference in AASE between<br />
the best- and worst-case interference configurations<br />
goes to zero.<br />
Telektronikk 1.2001<br />
ALSE<br />
AASE<br />
8<br />
7<br />
6<br />
5<br />
4<br />
3<br />
2<br />
10<br />
8<br />
6<br />
4<br />
2<br />
0<br />
100<br />
2<br />
200<br />
r<br />
300<br />
400<br />
500 1000<br />
Figure 4 ALSE [bits/s/Hz] as a function of D [m] and r [m]<br />
Figure 5 AASE [bits/s/Hz/km 2 ] as a function of the normalized<br />
reuse distance R n when r = D/2 and D ∈ {400, 600, 800, 1000}<br />
For the best-case interference configuration, the<br />
AASE has maximum value for R n = 2 when<br />
D ∈ {600,800,1000} and R n = 3 for D = 400.<br />
Unfortunately, the difference in AASE between<br />
the best- and worst-case interference configurations<br />
is very large for R n = 2. Hence, R n = 3 is<br />
a better choice. In other words, for the example<br />
ACM scheme, a cell cluster should consist of at<br />
least three cells using different sets of carrier frequencies.<br />
900<br />
800<br />
D=400<br />
D=600<br />
D=800<br />
D=1000<br />
700<br />
600<br />
D<br />
500<br />
400<br />
4 6 8 10<br />
Normalized reuse distance<br />
55


