- Page 4 and 5:
A publication of the Secretariat of
- Page 7 and 8:
CONTEMTSSARAWAK 314WEST MALAYSIA 31
- Page 9 and 10:
INTRODUCTIONSUMMARY1. Recent invest
- Page 11 and 12:
INTRODUCTIONoutboard motors, nylon
- Page 13:
.INTRODUCTIONSCOPE AND METHODSThe p
- Page 16 and 17:
..INTRODUCTIONshown to deserve form
- Page 18 and 19:
INTRODUCTIONMARINE TURTLE BIOLOGY A
- Page 20 and 21:
...INTRODUCTIONExcept for the nesti
- Page 22:
INTRODUCTION5 000 C. mydas nested i
- Page 25 and 26:
INTRODUCTIONMigration and philopatr
- Page 27 and 28:
INTRODUCTIONBut harvesting is rarel
- Page 29 and 30:
..INTRODUCTIONIf the details of hom
- Page 31 and 32:
INTRODUCTIONrelatively large averag
- Page 33 and 34:
INTRODUCTIONMethods ofturtle exploi
- Page 35 and 36:
INTRODUCTIONextremely heavy harvest
- Page 38 and 39:
INTRODUCTIONmight otherwise have su
- Page 40 and 41:
INTRODUCTION"preservationists in th
- Page 44 and 45:
INTRODUCTIONAlthough in global term
- Page 46 and 47:
INTRODUCTIONVery large quantities o
- Page 48 and 49:
I u-> I I I I II l/^ I i CM i I >0
- Page 50 and 51:
INTRODUCTIONsuggested (e.g. Dodd ,
- Page 52 and 53:
INTRODOCTIOMone of the recorded cau
- Page 54 and 55:
INTRODUCTIONNote^: the "indication
- Page 56 and 57:
INTRODUCTIOMNevertheless, there is
- Page 58 and 59:
INTRODUCTIONbecause of over-exploit
- Page 60 and 61:
INTRODUCTIONConservation status and
- Page 62 and 63:
INTRODUCTIONTable 11, continued.Che
- Page 64 and 65:
INTRODUCTIONTable 11, continued.Che
- Page 67 and 68:
AMERICAN SAMOAPOPULATION:Chelonia m
- Page 69 and 70:
ANGOLAPOPULATION:Chelonla mydasNest
- Page 71 and 72:
ANGUILLAPOPULATION:Chelonia mydasNe
- Page 73 and 74:
ANGUILLALEGISLATIONTurtle Ordinance
- Page 75 and 76:
ANTIGUA AND BARBUDA(1978, cited in
- Page 77 and 78:
ARUBAPOPULATION:Chelonia mydasNesti
- Page 79 and 80:
ASCENSION AND ST HELENAForaging sit
- Page 81 and 82:
AUSTRALIAAUSTRALIA:QUEENSLANDPOPULA
- Page 83 and 84:
AUSTEtALIAEXPLOITATIONThe main spec
- Page 85 and 86:
AUSTEUI.IADomestic trade Commercial
- Page 87 and 88:
VsAUSTRALIAArchipelago, all off the
- Page 89 and 90:
AUSTRALIALEGISLATIONWildlife Conser
- Page 91 and 92:
BAHAMASPOPULATION:Chelonia mydasNes
- Page 93 and 94:
BAHAMASTable 18. Green Turtle and H
- Page 95 and 96:
BAHRAINGreen Turtles are reported t
- Page 97 and 98:
BANGLADESHCITES Annual Reports cont
- Page 99 and 100:
BARBADOSRANCHING/ HATCHERIESAn expe
- Page 101 and 102:
BELIZEForaging sites Whilst nesting
- Page 103 and 104:
BELIZEWildlife Protection Act 1981
- Page 105 and 106:
BERMUDAPOPULATION:Chelonia mydasNes
- Page 107 and 108:
BRAZILPOPULATION:Chelonia mydasNest
- Page 109 and 110:
BRAZILPara are said to catch 0.2-0.
- Page 111 and 112:
BRAZILPortaria No. N-005, 31 Januar
- Page 113 and 114:
BRITISH INDIAN OCEAN TERRITORIESFor
- Page 115 and 116:
BRITISH VIRGIN ISLANDSPOPULATION:Ch
- Page 117 and 118:
BRITISH VIRGIN ISLANDSEXPLOITATIONC
- Page 119 and 120:
BRUNEIPOPULATIONAccording to Harris
- Page 121 and 122:
BURMAegg collection, now support mi
- Page 123 and 124:
BURMATable 30. Marine turtle eggs c
- Page 125 and 126:
BURMADomestic trade Most of the egg
- Page 127 and 128:
CANARY ISLANDS(SPAIN)There is only
- Page 129 and 130:
CAYMAN ISLANDSPOPULATIONThe breedin
- Page 131 and 132:
CAYMAN ISLANDSTable 33. Direct expo
- Page 133 and 134:
CAYMAN ISLANDSTable 36. Imports of
- Page 135 and 136:
CAYMAN ISLANDS(E.G. Roet in litt. t
- Page 137 and 138:
CAYMAN ISLANDSThe Marine Conservati
- Page 139 and 140:
CHINA,PEOPLE'S REPUBLIC OFPOPULATIO
- Page 141 and 142:
CHINA,PEOPLE'S REPUBLIC OFHistorica
- Page 143 and 144:
COLOMBIACOLOMBIA:CASIBBBANPOPULATIO
- Page 145 and 146:
COLOMBIAEXPLOITATIONComnodity Green
- Page 147 and 148:
COLOMBIAconcerning permits for hunt
- Page 149 and 150:
COMORO ISLANDSJune. The peak appear
- Page 151 and 152:
CONGONo recent information is avail
- Page 153 and 154:
COOK ISLANDSPalmerston. About 50 tu
- Page 155 and 156:
COSTA RICATrends in nesting numbers
- Page 157 and 158:
COSTA RICATHREATSExploitation of tu
- Page 159 and 160:
COSTA RICACOSTA RICA:PACIFICPOPULAT
- Page 161 and 162:
CUBAPOPULATION: Chelonia mydas . Kr
- Page 163 and 164:
CUBAof 250 kg, 215 kg and 75 kg of
- Page 165 and 166:
CYPRUSPOPULATION :Chelonia mydasNes
- Page 167 and 168:
CYPRUSLEGISLATIONFisheries Regulati
- Page 169 and 170:
IXMnNICAPOPULATION:Chalonla mydasNe
- Page 171 and 172:
DOMINICALEGISLATIONTurtle Ordinance
- Page 173 and 174:
DOMINICAN REPUBLICTable 52. Estimat
- Page 175 and 176:
DOMINICAN REPUBLICTable S3. Officia
- Page 177 and 178:
DOMINICAN REPUBLIC"commercial". Thi
- Page 179 and 180:
ECUADORTHREATSNo information locate
- Page 181 and 182:
ECUADORHurtado notes some movement
- Page 183 and 184:
EGYPTEGYPT:MEDITERRANEANPOPULATIONA
- Page 185 and 186:
EGYPTcurios, but not, apparently, i
- Page 187 and 188:
EQUATORIAL GUINEAEQUATORIAL GUINEA:
- Page 189 and 190:
ETHIOPIAPOPULATION: Chelonia mydaa
- Page 191 and 192:
FEDERATED STATES OF MICRONESIAwere
- Page 193 and 194:
FIJIPOPULATIOK :Chelonia mydasNesti
- Page 195 and 196:
FIJIThere is little qualitative inf
- Page 198 and 199:
~H01 «1-1 3^ >Lie0)iH« 2O VI-U g
- Page 200 and 201:
FRENCH GUIANAPOPULATION:Chelonla my
- Page 202 and 203:
FRENCH GUIANAArrete Prefectoral No.
- Page 204 and 205:
FRENCH POLYNESIATable 66. Total tra
- Page 206 and 207:
FRENCH POLYNESIAshow exports of 425
- Page 208 and 209:
GAMBIANo information is available o
- Page 210 and 211:
GRENADA AND THE GRENADIAN GRENADINE
- Page 212 and 213:
GRENADA AND THE GRENADIAN GRENADINE
- Page 214 and 215:
GUADELOUPE AND DEPENDENCIESNesting
- Page 216 and 217:
GUAMPOPULATION:Chelonia mydasNestin
- Page 218 and 219:
GUATEMALAGUATEMALA:CARIBBEANPOPULAT
- Page 220 and 221:
GUATEMALAEXPLOITATIONCommodity Corn
- Page 222 and 223:
GUINEA BISSAUNo information availab
- Page 224 and 225:
GUYANATHREATSReichart et al (198A)
- Page 226 and 227:
HAITIin view of the quantity of tor
- Page 228 and 229:
1973
- Page 230 and 231:
HAWAIITable
- Page 232 and 233:
HONDURASHONDURAS:CARIBBEANPOPULATIO
- Page 234 and 235:
HONDURASDomestic trade Green Turtle
- Page 236 and 237:
HONDURASestablishes closed seasons,
- Page 238 and 239:
HONG KONGTable 75. Sources of impor
- Page 240 and 241:
INDIANesting numbers Nesting number
- Page 242 and 243:
INDIATable 77. Domestic exports of
- Page 244 and 245:
INDIAEXPLOITATIONConmodlty Both C.
- Page 246 and 247:
INDIAThe Andamans E. imbricata popu
- Page 248 and 249:
INDONESIAPangumbahan (SW Java),beac
- Page 250 and 251:
. SulawesiINDONESIATable 81continue
- Page 252 and 253:
1INDONESIAharvests are low in the b
- Page 254 and 255:
INDONESIAlaid at Pangumbahan. Schul
- Page 256 and 257:
mydasINDONESIALemukutanAlthough Sal
- Page 258 and 259:
INDONESIATable 88. Known E^ jmbrira
- Page 260 and 261:
INDONESIAparts of Riau and in Sulaw
- Page 262 and 263:
INDONESIAP. Pesambung, and perhaps
- Page 264 and 265:
INDONESIAThe harvest of adult E. im
- Page 266 and 267:
1INDONESIAjewellery. Most of the to
- Page 268 and 269:
INDONESIAEven allowing for the fact
- Page 270 and 271:
INDONESIAJavaHawksbill rearing oper
- Page 272 and 273:
0000n00CM0001c o c-P00O03LiOaSILio
- Page 274 and 275:
INDONESIATable 97. Percentage by we
- Page 276 and 277:
IRANfresh; it seems lilcely that a
- Page 278 and 279:
ISRAELPOPULATION:Chelonia mydasNest
- Page 280 and 281:
iIVORY COASTNo information availabl
- Page 282 and 283:
JAMAICAHunting intensity Official S
- Page 284 and 285:
JAPANPOPULATION:Chelonia mydasNesti
- Page 286 and 287:
JAPANHunting methods Host of the tu
- Page 288 and 289:
I nIIII c^I u^f^ I i ^I o»—II r^
- Page 290:
I I lO I I I I< I I I10I I I I II I
- Page 295 and 296:
KAMPUCHEAAccording to Bourret (1941
- Page 297 and 298:
KENYAPOPULAT I ON :Chelonia mydasNe
- Page 299 and 300:
KENYAto Japan in 1976, 1977 and 197
- Page 301 and 302:
KIRIBATILine and Gilbert groups; Ba
- Page 303 and 304:
KIRIBATIcatching 200-300 Green turt
- Page 305 and 306:
KOREA,REPUBLIC OFTable 111. Destina
- Page 307 and 308:
LIBERIASome nesting by C. mydas has
- Page 309 and 310:
MADAGASCARevidence, Europa must mak
- Page 311 and 312:
. mydasMADAGASCARTable 112.Madagasc
- Page 313 and 314:
MADAGASCARTable llA. Imports of raw
- Page 315 and 316:
MALAYSIAMALAYSIA:SABAHPOPULATIOK :C
- Page 317 and 318:
MALAYSIA1983 bearing a Philippines
- Page 319 and 320:
MALAYSIAlogarithmically transformed
- Page 321 and 322:
MALAYSIACustoms (Prohibition of Imp
- Page 323 and 324:
MALAYSIATable 122. Reported egg pro
- Page 325 and 326:
MALAYSIAThe only period when signif
- Page 327 and 328:
MALAYSIAWEST MALAYSIAPOPULATION:Che
- Page 329 and 330:
MALAYSIAinterpreting yield data fro
- Page 331 and 332:
MALAYSIAand 1978 there was a substa
- Page 333 and 334:
MALAYSIATable 131. International tr
- Page 335 and 336:
MALAYSIAA fifth hatchery was starte
- Page 337 and 338:
MALDIVESNesting season Didi (1983)
- Page 339 and 340:
MALDIVESthe 15 000 tourists were es
- Page 341 and 342:
MARSHALL ISLANDS.REPUBLIC OFPOPULAT
- Page 343 and 344:
HAHTINIQUEPOPULATION :Chelonia myda
- Page 345 and 346:
MARTINIQUEDomingue" (Dominican Repu
- Page 347 and 348:
MAURITANIAHunting methods Turtles a
- Page 349 and 350:
MAURITIUS AND DEPENDENCIESTable 138
- Page 351 and 352:
MAURITIUS AND DEPENDENCIESTable 139
- Page 353 and 354:
MAYOTTKPOPULATION:Chelonia mydasNes
- Page 355 and 356:
MAYOTTK1987) recorded A2 shells fro
- Page 357 and 358:
MEXICOTable 141. Nest sites and est
- Page 359 and 360:
MEXICOTable 1A2. Nest sites and est
- Page 361 and 362:
MEXICOCampeche As noted above, Camp
- Page 363 and 364:
MEXICOno production at all was reco
- Page 365 and 366:
MEXICONesting season Nesting season
- Page 367 and 368:
MEXICOUntil the 1950s tortoiseshell
- Page 369 and 370:
MEXICO( Chelonia mydas or perhaps E
- Page 371 and 372:
MEXICOfigures, and based on an offi
- Page 373 and 374:
AtMEXICOalthough Alvarado and Figue
- Page 375 and 376:
MEXICOorigin Cayman Islands to Hong
- Page 377 and 378:
HONTSERE(ATDomestic trade Jeffers a
- Page 379 and 380:
MOZAMBIQUESingar and Mefunvo, near
- Page 381 and 382:
NAMIBIAWhile C. mydas is known to e
- Page 383 and 384:
NETHERLANDS ANTILLESNETHERLANDS ANT
- Page 385 and 386:
NETHERLANDS ANTILLESNETHERLANDS ANT
- Page 387 and 388:
NETHERLANDS ANTILLESSt Maarten: Spe
- Page 389 and 390:
NEW CALEDONIAPOPULATION:Chelonia my
- Page 391 and 392:
NEW CALEDONIAHunting methods Some t
- Page 393 and 394:
NICARAGUANICARAGUA:CARIBBEANPOPULAT
- Page 395 and 396:
NICASAGUAwages. Nietschmann (1981)
- Page 397 and 398: NICARAGUAThe figures for 1980-82 ac
- Page 399 and 400: NIGERIANo information available. Bo
- Page 401 and 402: NORTHERN MARIANAS,COMMONWEALTH OFPO
- Page 403 and 404: OMANalthough the species compositio
- Page 405 and 406: OMANHistorical trends There is no d
- Page 407 and 408: PAKISTANTable 153. Nesting emergenc
- Page 409 and 410: PAKISTANbakeries who used them in b
- Page 411 and 412: PALAU REPUBLICPOPULATION :Chelonia
- Page 413 and 414: PALAU REPUBLICHunting methods Palau
- Page 415 and 416: PANAMAPANAMA:CARIBBEANPOPULATION:Ch
- Page 417 and 418: PANAMATable 155. Exports of tortols
- Page 419 and 420: PANAMAEXPLOITATIONAccording to Corn
- Page 421 and 422: PAPUA NEW GUINEAfrom West Sepik. Pr
- Page 423 and 424: PAPUA NEW GUINEAinvolves many taboo
- Page 425 and 426: PERUGreen Turtles have never been p
- Page 427 and 428: PHILIPPINESPOPULATION:Chelonia myda
- Page 429 and 430: PHILIPPINESambiguous. Reyes ( in li
- Page 431 and 432: PHILIPPINESHunting intensity In spi
- Page 433 and 434: PHILIPPINESStuffing industry in Zam
- Page 435 and 436: PHILIPPINESTable 166. Imports of "T
- Page 437 and 438: PHILIPPINESThe remaining 60% may be
- Page 439 and 440: PUERTO RICOPOPULATION :Chelonla myd
- Page 441 and 442: PUERTO RICOLEGISLATIONReglajnento D
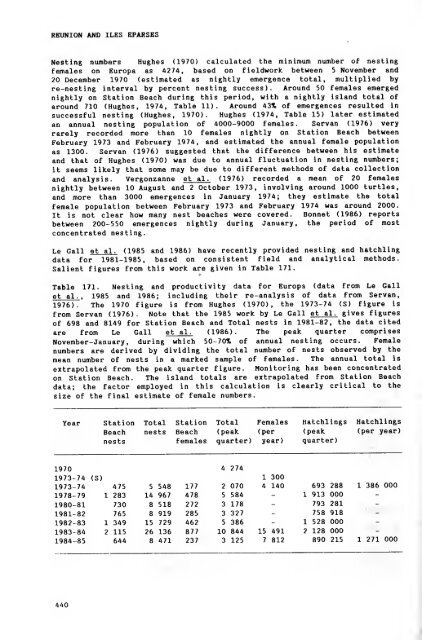
- Page 443 and 444: REUKION AND ILESBPARSESREUNIONReuni
- Page 445 and 446: REUNION AND ILESEPARSESTable 169. H
- Page 447: REUNION AND ILESEPARSESTable 169, a
- Page 451 and 452: REUNION AND ILBS EPARSBScatch. This
- Page 453 and 454: REUNION AND ILESEPARSESthe surface
- Page 455 and 456: SAO TOME AND PRINCIPEVirtually no r
- Page 457 and 458: SAUDI ARABIANesting numbers No deta
- Page 459 and 460: SAUDI ARABIAMigration No specific i
- Page 461 and 462: ISENEGALPOPULAT I ON :Chelonia myda
- Page 463 and 464: SEYCHELLESPOPULATION:Chelonia mydas
- Page 465 and 466: SEYCHELLESwould thus have included
- Page 467 and 468: SEYCHELLESaround Lhe Mozambiqup Cha
- Page 469 and 470: SEYCHELLESTable 176. continuedFrazi
- Page 471 and 472: SEYCHELLESmeat could have been eate
- Page 473 and 474: SEYCHELLESTable 177. continuedYear
- Page 475 and 476: SEYCHELLESThe Seychelles submitted
- Page 477 and 478: SEYCHELLESotherwise take possession
- Page 479 and 480: SINGAPOREPOPULATIONWhile both C. my
- Page 481 and 482: SINGAPOREwithoul a licence.Import o
- Page 483 and 484: SOLOMON ISLANDSManning Straits midw
- Page 485 and 486: SOLOMON ISLANDSalso been a tendency
- Page 487 and 488: SOMALIAPOPULATION :Chelonia mydasNe
- Page 489 and 490: SOMALIAwork, five 20-m nets. Remora
- Page 491 and 492: SOUTH AFRICABoth C. mydas and E. im
- Page 493 and 494: SRILANKAPOPULATION :Chelonia mydasN
- Page 495 and 496: SRILANKAHistorical trends Turtle ex
- Page 497 and 498: SRILANKAhave ceased to nest on the
- Page 499 and 500:
STKITTS-NBVISTHREATSAccording to To
- Page 501 and 502:
ST LUCIAPOPULATION : Chelonia mydas
- Page 503 and 504:
STLUCIAA trader from St Lucia, Char
- Page 505 and 506:
ST VINCENT AND THE ST VINCENT GRENA
- Page 507 and 508:
SUDANPOPULATION :Chelonia mydaaTher
- Page 509 and 510:
SURINAMEPOPULATION:Chelonia mydasNe
- Page 511 and 512:
SURINAHEBigisanti Beach except for
- Page 513 and 514:
SURINAMGTable 194. Estimates of the
- Page 515 and 516:
SURINAMEA proposal was prepared tuc
- Page 517 and 518:
TAIWANTable 196. Destinations of ex
- Page 519 and 520:
TANZANIAPOPULATION:Chelonla mydaaNe
- Page 521 and 522:
TANZANIAyear. Japanese Customs repo
- Page 523 and 524:
THAILANDPOPULATION:Chelonia mydasNe
- Page 525 and 526:
THAILANDEXPLOITATIONCommodity The p
- Page 527 and 528:
THAILANDDomestic trade Turtle eggs
- Page 529 and 530:
THAILANDimposed for failure to comp
- Page 531 and 532:
TOKBLAUPOPULATION:Chalonla mydasNes
- Page 533 and 534:
TONGAPOPULATION :Chelonia mydasNest
- Page 535 and 536:
TONGAInternational trade Tonga is n
- Page 537 and 538:
TRINIDAD AND TOBAGOother observatio
- Page 539 and 540:
TRINIDAD AND TOBAGOand up to TT$8.0
- Page 541 and 542:
TURKEYMigration In the absence of t
- Page 543 and 544:
TURKS AND CAICOSISLANDSPOPULATION:C
- Page 545 and 546:
18-5TURKS AND CAICOSISLANDSturtles.
- Page 547 and 548:
TUVALUturtles seen at sea or on the
- Page 549 and 550:
USAPOPULATION:Chelonia mydasNesting
- Page 551 and 552:
USAHunting intensity Since the liii
- Page 553 and 554:
mydasus PACIFIC ISLANDSJARVISISLAND
- Page 555 and 556:
us VIRGIN ISLANDSTrends in nesting
- Page 557 and 558:
VANUATUPOPULATION Little informatio
- Page 559 and 560:
VENEZUELAPOPULATION :Chelonia mydas
- Page 561 and 562:
VENEZUELAforaging in Venezuelan wat
- Page 563 and 564:
mydasVIET NAMPOPULATION: Chelonia m
- Page 565 and 566:
VIET NAMThe lurtlos grt-w to 12 ini
- Page 567 and 568:
WESTERN SAHARANo information availa
- Page 569 and 570:
WESTERN SAMOAEXPLOITATIONContimodit
- Page 571 and 572:
YEMEN, ARAB REPUBLICPOPULATIONFour
- Page 573 and 574:
YEMEN, PEOPLE'S DEMOCRATIC REPUBLIC
- Page 575 and 576:
mydasYEMEN, PEOPLE'S DEMOCRATIC REP
- Page 577:
ZAIRENo recent information is avail
- Page 580 and 581:
Gonioz,ACKNOWLKDGKMEMTSS.W. Garland
- Page 582 and 583:
EarthlinesREFERENCESAnon. (I'JSJb).
- Page 584 and 585:
ofREFERENCESBalnzB, G.H. (1985b). H
- Page 586 and 587:
REFERENCESBrown, R.A., Harvey, G.C.
- Page 588 and 589:
iREFERENCESCliffLon, K., Cornejo, D
- Page 590 and 591:
REFERENCESFAO (1973). Report to the
- Page 592 and 593:
REFERENCESGarnett, M.C. (1979?) The
- Page 594 and 595:
REFERENCESHillstead, H.O., Richards
- Page 596 and 597:
REFERENCESJenkins, R.W.G. (19/8). T
- Page 598 and 599:
REFERENCESLeh, Charles M.U., Poon ,
- Page 600 and 601:
REFERENCESMayL, K.ti. (1986). I'rol
- Page 602 and 603:
REFERENCESMfosov::Ky, N. (1983). Co
- Page 604 and 605:
REFERENCESPritchard, F.C.H. (1982a)
- Page 606 and 607:
REFERENCESSchulz, J. P. (1984). Tuf
- Page 608 and 609:
CentreREFERENCESUchida, I. (1980).