MPLAB ICD 3 In-Circuit Debugger User's Guide
MPLAB ICD 3 In-Circuit Debugger User's Guide
MPLAB ICD 3 In-Circuit Debugger User's Guide
- No tags were found...
You also want an ePaper? Increase the reach of your titles
YUMPU automatically turns print PDFs into web optimized ePapers that Google loves.
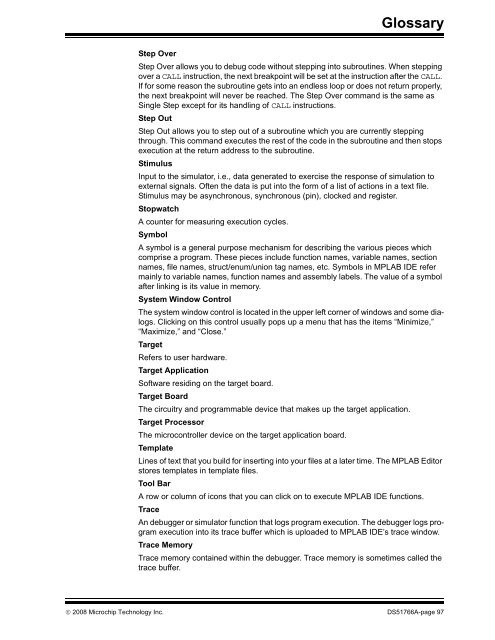
GlossaryStep OverStep Over allows you to debug code without stepping into subroutines. When steppingover a CALL instruction, the next breakpoint will be set at the instruction after the CALL.If for some reason the subroutine gets into an endless loop or does not return properly,the next breakpoint will never be reached. The Step Over command is the same asSingle Step except for its handling of CALL instructions.Step OutStep Out allows you to step out of a subroutine which you are currently steppingthrough. This command executes the rest of the code in the subroutine and then stopsexecution at the return address to the subroutine.Stimulus<strong>In</strong>put to the simulator, i.e., data generated to exercise the response of simulation toexternal signals. Often the data is put into the form of a list of actions in a text file.Stimulus may be asynchronous, synchronous (pin), clocked and register.StopwatchA counter for measuring execution cycles.SymbolA symbol is a general purpose mechanism for describing the various pieces whichcomprise a program. These pieces include function names, variable names, sectionnames, file names, struct/enum/union tag names, etc. Symbols in <strong>MPLAB</strong> IDE refermainly to variable names, function names and assembly labels. The value of a symbolafter linking is its value in memory.System Window ControlThe system window control is located in the upper left corner of windows and some dialogs.Clicking on this control usually pops up a menu that has the items “Minimize,”“Maximize,” and “Close.”TargetRefers to user hardware.Target ApplicationSoftware residing on the target board.Target BoardThe circuitry and programmable device that makes up the target application.Target ProcessorThe microcontroller device on the target application board.TemplateLines of text that you build for inserting into your files at a later time. The <strong>MPLAB</strong> Editorstores templates in template files.Tool BarA row or column of icons that you can click on to execute <strong>MPLAB</strong> IDE functions.TraceAn debugger or simulator function that logs program execution. The debugger logs programexecution into its trace buffer which is uploaded to <strong>MPLAB</strong> IDE’s trace window.Trace MemoryTrace memory contained within the debugger. Trace memory is sometimes called thetrace buffer.© 2008 Microchip Technology <strong>In</strong>c. DS51766A-page 97


