MPLAB ICD 3 In-Circuit Debugger User's Guide
MPLAB ICD 3 In-Circuit Debugger User's Guide
MPLAB ICD 3 In-Circuit Debugger User's Guide
- No tags were found...

Create successful ePaper yourself
Turn your PDF publications into a flip-book with our unique Google optimized e-Paper software.
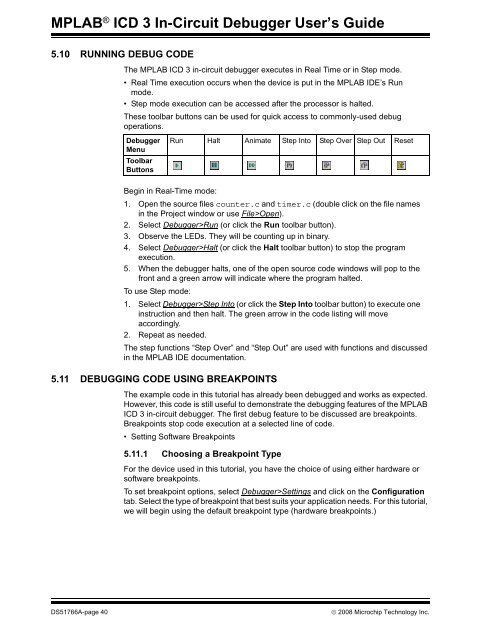
<strong>MPLAB</strong> ® <strong>ICD</strong> 3 <strong>In</strong>-<strong>Circuit</strong> <strong>Debugger</strong> User’s <strong>Guide</strong>5.10 RUNNING DEBUG CODEThe <strong>MPLAB</strong> <strong>ICD</strong> 3 in-circuit debugger executes in Real Time or in Step mode.• Real Time execution occurs when the device is put in the <strong>MPLAB</strong> IDE’s Runmode.• Step mode execution can be accessed after the processor is halted.These toolbar buttons can be used for quick access to commonly-used debugoperations.<strong>Debugger</strong>MenuToolbarButtonsBegin in Real-Time mode:1. Open the source files counter.c and timer.c (double click on the file namesin the Project window or use File>Open).2. Select <strong>Debugger</strong>>Run (or click the Run toolbar button).3. Observe the LEDs. They will be counting up in binary.4. Select <strong>Debugger</strong>>Halt (or click the Halt toolbar button) to stop the programexecution.5. When the debugger halts, one of the open source code windows will pop to thefront and a green arrow will indicate where the program halted.To use Step mode:1. Select <strong>Debugger</strong>>Step <strong>In</strong>to (or click the Step <strong>In</strong>to toolbar button) to execute oneinstruction and then halt. The green arrow in the code listing will moveaccordingly.2. Repeat as needed.The step functions “Step Over” and “Step Out” are used with functions and discussedin the <strong>MPLAB</strong> IDE documentation.5.11 DEBUGGING CODE USING BREAKPOINTSRun Halt Animate Step <strong>In</strong>to Step Over Step Out ResetThe example code in this tutorial has already been debugged and works as expected.However, this code is still useful to demonstrate the debugging features of the <strong>MPLAB</strong><strong>ICD</strong> 3 in-circuit debugger. The first debug feature to be discussed are breakpoints.Breakpoints stop code execution at a selected line of code.• Setting Software Breakpoints5.11.1 Choosing a Breakpoint TypeFor the device used in this tutorial, you have the choice of using either hardware orsoftware breakpoints.To set breakpoint options, select <strong>Debugger</strong>>Settings and click on the Configurationtab. Select the type of breakpoint that best suits your application needs. For this tutorial,we will begin using the default breakpoint type (hardware breakpoints.)DS51766A-page 40© 2008 Microchip Technology <strong>In</strong>c.