MPLAB ICD 3 In-Circuit Debugger User's Guide
MPLAB ICD 3 In-Circuit Debugger User's Guide
MPLAB ICD 3 In-Circuit Debugger User's Guide
- No tags were found...
You also want an ePaper? Increase the reach of your titles
YUMPU automatically turns print PDFs into web optimized ePapers that Google loves.
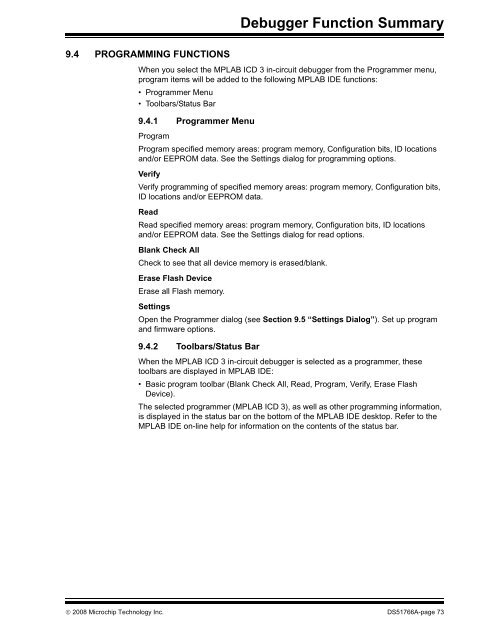
<strong>Debugger</strong> Function Summary9.4 PROGRAMMING FUNCTIONSWhen you select the <strong>MPLAB</strong> <strong>ICD</strong> 3 in-circuit debugger from the Programmer menu,program items will be added to the following <strong>MPLAB</strong> IDE functions:• Programmer Menu• Toolbars/Status Bar9.4.1 Programmer MenuProgramProgram specified memory areas: program memory, Configuration bits, ID locationsand/or EEPROM data. See the Settings dialog for programming options.VerifyVerify programming of specified memory areas: program memory, Configuration bits,ID locations and/or EEPROM data.ReadRead specified memory areas: program memory, Configuration bits, ID locationsand/or EEPROM data. See the Settings dialog for read options.Blank Check AllCheck to see that all device memory is erased/blank.Erase Flash DeviceErase all Flash memory.SettingsOpen the Programmer dialog (see Section 9.5 “Settings Dialog”). Set up programand firmware options.9.4.2 Toolbars/Status BarWhen the <strong>MPLAB</strong> <strong>ICD</strong> 3 in-circuit debugger is selected as a programmer, thesetoolbars are displayed in <strong>MPLAB</strong> IDE:• Basic program toolbar (Blank Check All, Read, Program, Verify, Erase FlashDevice).The selected programmer (<strong>MPLAB</strong> <strong>ICD</strong> 3), as well as other programming information,is displayed in the status bar on the bottom of the <strong>MPLAB</strong> IDE desktop. Refer to the<strong>MPLAB</strong> IDE on-line help for information on the contents of the status bar.© 2008 Microchip Technology <strong>In</strong>c. DS51766A-page 73


