MPLAB ICD 3 In-Circuit Debugger User's Guide
MPLAB ICD 3 In-Circuit Debugger User's Guide
MPLAB ICD 3 In-Circuit Debugger User's Guide
- No tags were found...
You also want an ePaper? Increase the reach of your titles
YUMPU automatically turns print PDFs into web optimized ePapers that Google loves.
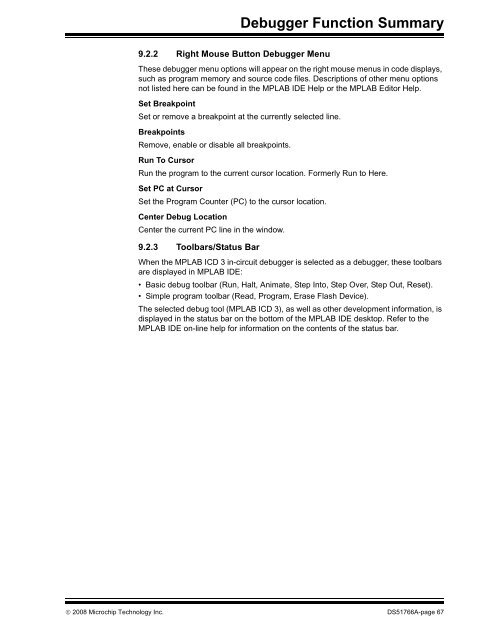
<strong>Debugger</strong> Function Summary9.2.2 Right Mouse Button <strong>Debugger</strong> MenuThese debugger menu options will appear on the right mouse menus in code displays,such as program memory and source code files. Descriptions of other menu optionsnot listed here can be found in the <strong>MPLAB</strong> IDE Help or the <strong>MPLAB</strong> Editor Help.Set BreakpointSet or remove a breakpoint at the currently selected line.BreakpointsRemove, enable or disable all breakpoints.Run To CursorRun the program to the current cursor location. Formerly Run to Here.Set PC at CursorSet the Program Counter (PC) to the cursor location.Center Debug LocationCenter the current PC line in the window.9.2.3 Toolbars/Status BarWhen the <strong>MPLAB</strong> <strong>ICD</strong> 3 in-circuit debugger is selected as a debugger, these toolbarsare displayed in <strong>MPLAB</strong> IDE:• Basic debug toolbar (Run, Halt, Animate, Step <strong>In</strong>to, Step Over, Step Out, Reset).• Simple program toolbar (Read, Program, Erase Flash Device).The selected debug tool (<strong>MPLAB</strong> <strong>ICD</strong> 3), as well as other development information, isdisplayed in the status bar on the bottom of the <strong>MPLAB</strong> IDE desktop. Refer to the<strong>MPLAB</strong> IDE on-line help for information on the contents of the status bar.© 2008 Microchip Technology <strong>In</strong>c. DS51766A-page 67


