AED 10 User Manual - Welch Allyn
AED 10 User Manual - Welch Allyn
AED 10 User Manual - Welch Allyn

Create successful ePaper yourself
Turn your PDF publications into a flip-book with our unique Google optimized e-Paper software.
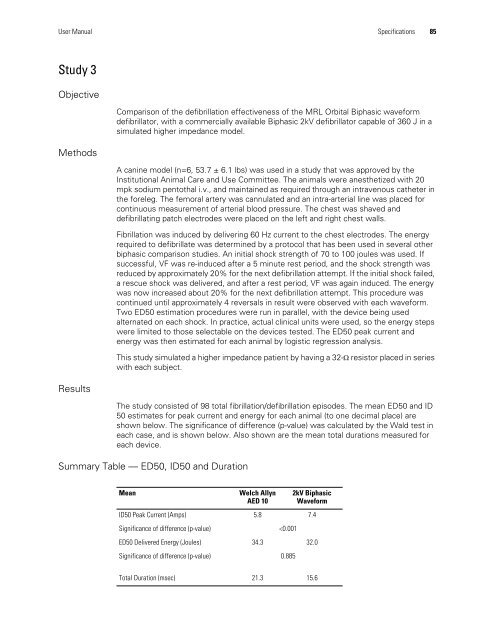
<strong>User</strong> <strong>Manual</strong> Specifications 85Study 3ObjectiveMethodsResultsComparison of the defibrillation effectiveness of the MRL Orbital Biphasic waveformdefibrillator, with a commercially available Biphasic 2kV defibrillator capable of 360 J in asimulated higher impedance model.A canine model (n=6, 53.7 ± 6.1 lbs) was used in a study that was approved by theInstitutional Animal Care and Use Committee. The animals were anesthetized with 20mpk sodium pentothal i.v., and maintained as required through an intravenous catheter inthe foreleg. The femoral artery was cannulated and an intra-arterial line was placed forcontinuous measurement of arterial blood pressure. The chest was shaved anddefibrillating patch electrodes were placed on the left and right chest walls.Fibrillation was induced by delivering 60 Hz current to the chest electrodes. The energyrequired to defibrillate was determined by a protocol that has been used in several otherbiphasic comparison studies. An initial shock strength of 70 to <strong>10</strong>0 joules was used. Ifsuccessful, VF was re-induced after a 5 minute rest period, and the shock strength wasreduced by approximately 20% for the next defibrillation attempt. If the initial shock failed,a rescue shock was delivered, and after a rest period, VF was again induced. The energywas now increased about 20% for the next defibrillation attempt. This procedure wascontinued until approximately 4 reversals in result were observed with each waveform.Two ED50 estimation procedures were run in parallel, with the device being usedalternated on each shock. In practice, actual clinical units were used, so the energy stepswere limited to those selectable on the devices tested. The ED50 peak current andenergy was then estimated for each animal by logistic regression analysis.This study simulated a higher impedance patient by having a 32- resistor placed in serieswith each subject.The study consisted of 98 total fibrillation/defibrillation episodes. The mean ED50 and ID50 estimates for peak current and energy for each animal (to one decimal place) areshown below. The significance of difference (p-value) was calculated by the Wald test ineach case, and is shown below. Also shown are the mean total durations measured foreach device.Summary Table — ED50, ID50 and DurationMean<strong>Welch</strong> <strong>Allyn</strong><strong>AED</strong> <strong>10</strong>2kV BiphasicWaveformID50 Peak Current (Amps) 5.8 7.4Significance of difference (p-value)