- Page 1:
USCC 2016 ANNUAL REPORT
- Page 5 and 6:
1 2016 REPORT TO CONGRESS of the U.
- Page 7 and 8:
U.S.-CHINA ECONOMIC AND SECURITY RE
- Page 9 and 10:
• The safety of food, drug, and o
- Page 11 and 12:
CONTENTS Page TRANSMITTAL LETTER TO
- Page 13: IX Page Recommendations ...........
- Page 16 and 17: 2 ernment’s “going out” strat
- Page 18 and 19: 4 economically and politically stra
- Page 20 and 21: 6 wage rates are determined by free
- Page 22 and 23: 8 while allowing a greater role for
- Page 24 and 25: 10 began construction on its first
- Page 26 and 27: 12 from—the People’s Republic o
- Page 28 and 29: 14 cluding cyber and human intellig
- Page 30 and 31: 16 exporter of manufactured goods,
- Page 32 and 33: 18 Pakistan’s economic and securi
- Page 34 and 35: 20 Beijing appears to remain skepti
- Page 36 and 37: 22 trends in Hong Kong with regard
- Page 38 and 39: 24 UNSCR 2270. However, in May and
- Page 40 and 41: 26 Korea, designating Dandong Hongx
- Page 42 and 43: 28 tional order—both before and a
- Page 44 and 45: 30 to examine China’s economic an
- Page 46 and 47: 32 debt, and jeopardizing long-term
- Page 49 and 50: Introduction CHAPTER 1 U.S.-CHINA E
- Page 51 and 52: 37 Statistics with Chinese Characte
- Page 53 and 54: 39 up from 52.3 percent in the seco
- Page 55 and 56: 41 Early signs suggest President Xi
- Page 57 and 58: 43 Figure 4: China’s Total Debt b
- Page 59 and 60: 45 reserves to defend the RMB. 75 I
- Page 61 and 62: 47 The pace of U.S. export growth t
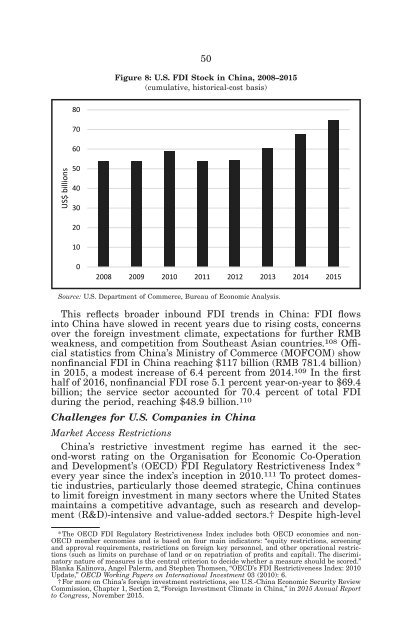
- Page 63: 49 The United States continued to r
- Page 67 and 68: 53 Table 3: Top Five Business Chall
- Page 69 and 70: 55 U.S. Tech Firms and Their Chines
- Page 71 and 72: 57 ment of Justice’s May 2014 ind
- Page 73 and 74: 59 Internet Censorship As a result
- Page 75 and 76: 61 on the future of U.S.-China rela
- Page 77 and 78: 63 Chapter 1, Section 2, “State-O
- Page 79 and 80: 65 Table 5: Failed Chinese Bids for
- Page 81 and 82: 67 • Accelerating Bilateral Inves
- Page 83 and 84: 69 cess capacity, which will share
- Page 85 and 86: 71 United States Challenges Chinese
- Page 87 and 88: 73 rulings of the DSB [Dispute Sett
- Page 89 and 90: 75 Conclusions • In 2015, the U.S
- Page 91 and 92: 77 Addendum I: WTO Cases Recent and
- Page 93 and 94: 79 ENDNOTES FOR SECTION 1 1. Lucy H
- Page 95 and 96: 81 55. Gabriel Wildau and Don Weinl
- Page 97 and 98: 83 119. American Chamber of Commerc
- Page 99 and 100: 85 and Espionage Operations, oral t
- Page 101 and 102: 87 217. Kane Wu, “Chinese Compani
- Page 103 and 104: 89 271. Office of the U.S. Trade Re
- Page 105 and 106: dkrause on DSKHT7XVN1PROD with USCC
- Page 107 and 108: 93 Lardy, senior fellow at the Pete
- Page 109 and 110: dkrause on DSKHT7XVN1PROD with USCC
- Page 111 and 112: dkrause on DSKHT7XVN1PROD with USCC
- Page 113 and 114: 99 pany competitiveness and stimula
- Page 115 and 116:
dkrause on DSKHT7XVN1PROD with USCC
- Page 117 and 118:
dkrause on DSKHT7XVN1PROD with USCC
- Page 119 and 120:
105 Table 2: Select Chinese Overcap
- Page 121 and 122:
107 levels. 135 The situation is on
- Page 123 and 124:
109 Figure 5: China’s Monthly Cru
- Page 125 and 126:
111 Figure 6: U.S. Steel Industry Q
- Page 127 and 128:
dkrause on DSKHT7XVN1PROD with USCC
- Page 129 and 130:
dkrause on DSKHT7XVN1PROD with USCC
- Page 131 and 132:
dkrause on DSKHT7XVN1PROD with USCC
- Page 133 and 134:
dkrause on DSKHT7XVN1PROD with USCC
- Page 135 and 136:
dkrause on DSKHT7XVN1PROD with USCC
- Page 137 and 138:
123 Addendum I: Section 15 of China
- Page 139 and 140:
125 Addendum II: AD and CVD Investi
- Page 141 and 142:
dkrause on DSKHT7XVN1PROD with USCC
- Page 143 and 144:
dkrause on DSKHT7XVN1PROD with USCC
- Page 145 and 146:
dkrause on DSKHT7XVN1PROD with USCC
- Page 147 and 148:
dkrause on DSKHT7XVN1PROD with USCC
- Page 149 and 150:
dkrause on DSKHT7XVN1PROD with USCC
- Page 151 and 152:
dkrause on DSKHT7XVN1PROD with USCC
- Page 153 and 154:
dkrause on DSKHT7XVN1PROD with USCC
- Page 155 and 156:
141 dkrause on DSKHT7XVN1PROD with
- Page 157 and 158:
143 lifetime cost of bringing the e
- Page 159 and 160:
145 gets achieved). 57 Using satell
- Page 161 and 162:
147 cost of compliance,’’ and p
- Page 163 and 164:
dkrause on DSKHT7XVN1PROD with USCC
- Page 165 and 166:
151 boost the efficiency of China
- Page 167 and 168:
dkrause on DSKHT7XVN1PROD with USCC
- Page 169 and 170:
dkrause on DSKHT7XVN1PROD with USCC
- Page 171 and 172:
Table 1: 157 Chinese Attempted and
- Page 173 and 174:
Table 1: 159 Chinese Attempted and
- Page 175 and 176:
dkrause on DSKHT7XVN1PROD with USCC
- Page 177 and 178:
163 Figure 4: China’s Total Debt-
- Page 179 and 180:
dkrause on DSKHT7XVN1PROD with USCC
- Page 181 and 182:
dkrause on DSKHT7XVN1PROD with USCC
- Page 183 and 184:
dkrause on DSKHT7XVN1PROD with USCC
- Page 185 and 186:
dkrause on DSKHT7XVN1PROD with USCC
- Page 187 and 188:
173 weapons, opens the U.S. militar
- Page 189 and 190:
175 ests, and allow for greater vol
- Page 191 and 192:
177 Addendum I: Key Targets in Chin
- Page 193 and 194:
179 Addendum I: Key Targets in Chin
- Page 195 and 196:
dkrause on DSKHT7XVN1PROD with USCC
- Page 197 and 198:
dkrause on DSKHT7XVN1PROD with USCC
- Page 199 and 200:
dkrause on DSKHT7XVN1PROD with USCC
- Page 201 and 202:
dkrause on DSKHT7XVN1PROD with USCC
- Page 203 and 204:
dkrause on DSKHT7XVN1PROD with USCC
- Page 205 and 206:
dkrause on DSKHT7XVN1PROD with USCC
- Page 207 and 208:
dkrause on DSKHT7XVN1PROD with USCC
- Page 209 and 210:
195 The ultimate impact of the ruli
- Page 211 and 212:
197 Environmental Impact of China
- Page 213 and 214:
dkrause on DSKHT7XVN1PROD with USCC
- Page 215 and 216:
201 China’s Maritime Disputes in
- Page 217 and 218:
203 Reform and Reorganization of th
- Page 219 and 220:
dkrause on DSKHT7XVN1PROD with USCC
- Page 221 and 222:
207 • PLA Army Headquarters: Chin
- Page 223 and 224:
dkrause on DSKHT7XVN1PROD with USCC
- Page 225 and 226:
211 Figure 5: Type 072A Tank Landin
- Page 227 and 228:
dkrause on DSKHT7XVN1PROD with USCC
- Page 229 and 230:
215 Figure 7: JL-2 Missile Range Co
- Page 231 and 232:
dkrause on DSKHT7XVN1PROD with USCC
- Page 233 and 234:
dkrause on DSKHT7XVN1PROD with USCC
- Page 235 and 236:
221 Space-Tracking Facility in Arge
- Page 237 and 238:
223 Table 1: Significant PLA Bilate
- Page 239 and 240:
dkrause on DSKHT7XVN1PROD with USCC
- Page 241 and 242:
227 Nigeria will be the first expor
- Page 243 and 244:
dkrause on DSKHT7XVN1PROD with USCC
- Page 245 and 246:
231 tional annexes to the 2014 Noti
- Page 247 and 248:
233 Select U.S.-China Security-Rela
- Page 249 and 250:
dkrause on DSKHT7XVN1PROD with USCC
- Page 251 and 252:
dkrause on DSKHT7XVN1PROD with USCC
- Page 253 and 254:
dkrause on DSKHT7XVN1PROD with USCC
- Page 255 and 256:
dkrause on DSKHT7XVN1PROD with USCC
- Page 257 and 258:
dkrause on DSKHT7XVN1PROD with USCC
- Page 259 and 260:
dkrause on DSKHT7XVN1PROD with USCC
- Page 261 and 262:
dkrause on DSKHT7XVN1PROD with USCC
- Page 263 and 264:
dkrause on DSKHT7XVN1PROD with USCC
- Page 265 and 266:
dkrause on DSKHT7XVN1PROD with USCC
- Page 267 and 268:
dkrause on DSKHT7XVN1PROD with USCC
- Page 269 and 270:
dkrause on DSKHT7XVN1PROD with USCC
- Page 271 and 272:
257 China’s Core Interests—Cont
- Page 273 and 274:
259 guerrillas in Colombia and held
- Page 275 and 276:
dkrause on DSKHT7XVN1PROD with USCC
- Page 277 and 278:
dkrause on DSKHT7XVN1PROD with USCC
- Page 279 and 280:
dkrause on DSKHT7XVN1PROD with USCC
- Page 281 and 282:
dkrause on DSKHT7XVN1PROD with USCC
- Page 283 and 284:
dkrause on DSKHT7XVN1PROD with USCC
- Page 285 and 286:
271 stan. 109 In 2014, the PLA Air
- Page 287 and 288:
dkrause on DSKHT7XVN1PROD with USCC
- Page 289 and 290:
275 conflict Chinese expeditionary
- Page 291 and 292:
dkrause on DSKHT7XVN1PROD with USCC
- Page 293 and 294:
279 RECOMMENDATIONS Developments in
- Page 295 and 296:
dkrause on DSKHT7XVN1PROD with USCC
- Page 297 and 298:
dkrause on DSKHT7XVN1PROD with USCC
- Page 299 and 300:
dkrause on DSKHT7XVN1PROD with USCC
- Page 301 and 302:
dkrause on DSKHT7XVN1PROD with USCC
- Page 303 and 304:
SECTION 3: CHINESE INTELLIGENCE SER
- Page 305 and 306:
291 Strategic Support Force In Dece
- Page 307 and 308:
293 of advanced intelligence, surve
- Page 309 and 310:
295 tives, and sexual entrapment. 4
- Page 311 and 312:
297 information to a Chinese intell
- Page 313 and 314:
299 such as power transmission grid
- Page 315 and 316:
301 for transferring trade secrets
- Page 317 and 318:
303 nal U.S. discussions of issues
- Page 319 and 320:
305 ENDNOTES FOR SECTION 3 1. U.S.-
- Page 321 and 322:
307 29. U.S. Department of Justice,
- Page 323 and 324:
309 63. U.S. Department of Justice,
- Page 325:
311 106. Eric Holder, “Attorney G
- Page 328 and 329:
314 sure its own ambitions in South
- Page 330 and 331:
316 Chinese foreign direct investme
- Page 332 and 333:
318 • Pakistan: In 2015, China an
- Page 334 and 335:
320 India “Acts East” and Puts
- Page 336 and 337:
322 Counter Terrorism and Religious
- Page 338 and 339:
324 tivities of the Dalai Lama and
- Page 340 and 341:
326 incursions across the border fr
- Page 342 and 343:
328 conducive to sea lane protectio
- Page 344 and 345:
330 Karachi Port, that could eventu
- Page 346 and 347:
332 India and OBOR India has not en
- Page 348 and 349:
334 China’s Arms Sales to Pakista
- Page 350 and 351:
336 For China, the goals of CPEC ar
- Page 352 and 353:
338 according to Mr. Small, “The
- Page 354 and 355:
340 side the Treaty on the Non-Prol
- Page 356 and 357:
342 Facets of U.S.-India Defense Re
- Page 358 and 359:
344 of China, but has advocated for
- Page 360 and 361:
346 • Recent U.S.-China tensions
- Page 362 and 363:
348 24. Debasish Roy Chowdhury, “
- Page 364 and 365:
350 71. Jeff Smith, Cold Peace: Chi
- Page 366 and 367:
352 127. U.S.-China Economic and Se
- Page 368 and 369:
354 2016, 86; Andrew Small, The Chi
- Page 370 and 371:
dkrause on DSKHT7XVN1PROD with USCC
- Page 372 and 373:
358 Taiwan’s Economic Challenges
- Page 374 and 375:
dkrause on DSKHT7XVN1PROD with USCC
- Page 376 and 377:
dkrause on DSKHT7XVN1PROD with USCC
- Page 378 and 379:
364 agreements. 57 Since then, many
- Page 380 and 381:
366 $67.2 billion, comprising 25.4
- Page 382 and 383:
368 Foreign Direct Investment China
- Page 384 and 385:
370 is leading the initiative, have
- Page 386 and 387:
dkrause on DSKHT7XVN1PROD with USCC
- Page 388 and 389:
374 Taiwan and the 11-Dash Line The
- Page 390 and 391:
dkrause on DSKHT7XVN1PROD with USCC
- Page 392 and 393:
dkrause on DSKHT7XVN1PROD with USCC
- Page 394 and 395:
dkrause on DSKHT7XVN1PROD with USCC
- Page 396 and 397:
dkrause on DSKHT7XVN1PROD with USCC
- Page 398 and 399:
384 trade-based partner to an innov
- Page 400 and 401:
dkrause on DSKHT7XVN1PROD with USCC
- Page 402 and 403:
dkrause on DSKHT7XVN1PROD with USCC
- Page 404 and 405:
390 • China’s military moderniz
- Page 406 and 407:
dkrause on DSKHT7XVN1PROD with USCC
- Page 408 and 409:
dkrause on DSKHT7XVN1PROD with USCC
- Page 410 and 411:
dkrause on DSKHT7XVN1PROD with USCC
- Page 412 and 413:
dkrause on DSKHT7XVN1PROD with USCC
- Page 414 and 415:
dkrause on DSKHT7XVN1PROD with USCC
- Page 416 and 417:
dkrause on DSKHT7XVN1PROD with USCC
- Page 418 and 419:
dkrause on DSKHT7XVN1PROD with USCC
- Page 420 and 421:
dkrause on DSKHT7XVN1PROD with USCC
- Page 422 and 423:
dkrause on DSKHT7XVN1PROD with USCC
- Page 424 and 425:
410 Hong Kong’s Political Gossip
- Page 426 and 427:
dkrause on DSKHT7XVN1PROD with USCC
- Page 428 and 429:
414 moving up one place compared to
- Page 430 and 431:
dkrause on DSKHT7XVN1PROD with USCC
- Page 432 and 433:
418 Chinese Censorship of Prize-Win
- Page 434 and 435:
420 Hong Kong and the ‘‘Panama
- Page 436 and 437:
dkrause on DSKHT7XVN1PROD with USCC
- Page 438 and 439:
424 Table 1: Select PLA Hong Kong G
- Page 440 and 441:
dkrause on DSKHT7XVN1PROD with USCC
- Page 442 and 443:
428 sitive periods in Hong Kong, le
- Page 444 and 445:
dkrause on DSKHT7XVN1PROD with USCC
- Page 446 and 447:
dkrause on DSKHT7XVN1PROD with USCC
- Page 448 and 449:
dkrause on DSKHT7XVN1PROD with USCC
- Page 450 and 451:
436 150. Commission meeting with Ta
- Page 452 and 453:
dkrause on DSKHT7XVN1PROD with USCC
- Page 454 and 455:
dkrause on DSKHT7XVN1PROD with USCC
- Page 456 and 457:
442 Korea. The resolution also bans
- Page 458 and 459:
444 increase pressure on Pyongyang.
- Page 460 and 461:
446 pand China-South Korea ties. 54
- Page 462 and 463:
448 Technical Details of THAAD The
- Page 464 and 465:
dkrause on DSKHT7XVN1PROD with USCC
- Page 466 and 467:
dkrause on DSKHT7XVN1PROD with USCC
- Page 468 and 469:
dkrause on DSKHT7XVN1PROD with USCC
- Page 470 and 471:
456 Korea runs perpetual merchandis
- Page 472 and 473:
dkrause on DSKHT7XVN1PROD with USCC
- Page 474 and 475:
460 pressure is more likely to brin
- Page 476 and 477:
462 ty for sanctions violations, co
- Page 478 and 479:
dkrause on DSKHT7XVN1PROD with USCC
- Page 480 and 481:
dkrause on DSKHT7XVN1PROD with USCC
- Page 482 and 483:
dkrause on DSKHT7XVN1PROD with USCC
- Page 484 and 485:
dkrause on DSKHT7XVN1PROD with USCC
- Page 486 and 487:
dkrause on DSKHT7XVN1PROD with USCC
- Page 489 and 490:
dkrause on DSKHT7XVN1PROD with USCC
- Page 491 and 492:
dkrause on DSKHT7XVN1PROD with USCC
- Page 493 and 494:
479 sailors would be stationed in J
- Page 495 and 496:
dkrause on DSKHT7XVN1PROD with USCC
- Page 497 and 498:
dkrause on DSKHT7XVN1PROD with USCC
- Page 499 and 500:
485 Table 1: U.S. Goods Trade with
- Page 501 and 502:
dkrause on DSKHT7XVN1PROD with USCC
- Page 503 and 504:
489 basis for President Obama’s c
- Page 505 and 506:
dkrause on DSKHT7XVN1PROD with USCC
- Page 507 and 508:
dkrause on DSKHT7XVN1PROD with USCC
- Page 509 and 510:
dkrause on DSKHT7XVN1PROD with USCC
- Page 511 and 512:
dkrause on DSKHT7XVN1PROD with USCC
- Page 513 and 514:
dkrause on DSKHT7XVN1PROD with USCC
- Page 515 and 516:
dkrause on DSKHT7XVN1PROD with USCC
- Page 517 and 518:
dkrause on DSKHT7XVN1PROD with USCC
- Page 519 and 520:
dkrause on DSKHT7XVN1PROD with USCC
- Page 521 and 522:
dkrause on DSKHT7XVN1PROD with USCC
- Page 523 and 524:
dkrause on DSKHT7XVN1PROD with USCC
- Page 525 and 526:
dkrause on DSKHT7XVN1PROD with USCC
- Page 527 and 528:
dkrause on DSKHT7XVN1PROD with USCC
- Page 529 and 530:
dkrause on DSKHT7XVN1PROD with USCC
- Page 531 and 532:
dkrause on DSKHT7XVN1PROD with USCC
- Page 533 and 534:
dkrause on DSKHT7XVN1PROD with USCC
- Page 535 and 536:
dkrause on DSKHT7XVN1PROD with USCC
- Page 537 and 538:
dkrause on DSKHT7XVN1PROD with USCC
- Page 539 and 540:
APPENDIX II BACKGROUND OF COMMISSIO
- Page 541 and 542:
dkrause on DSKHT7XVN1PROD with USCC
- Page 543 and 544:
dkrause on DSKHT7XVN1PROD with USCC
- Page 545 and 546:
dkrause on DSKHT7XVN1PROD with USCC
- Page 547 and 548:
dkrause on DSKHT7XVN1PROD with USCC
- Page 549 and 550:
APPENDIX III PUBLIC HEARINGS OF THE
- Page 551 and 552:
537 June 9, 2016: Public Hearing on
- Page 553 and 554:
APPENDIX IIIA LIST OF WITNESSES TES
- Page 555 and 556:
541 Alphabetical Listing of Panelis
- Page 557 and 558:
APPENDIX IV LIST OF RESEARCH MATERI
- Page 559 and 560:
dkrause on DSKHT7XVN1PROD with USCC
- Page 561 and 562:
547 China’s Military Agreements w
- Page 563 and 564:
APPENDIX V ACRONYMS AND ABBREVIATIO
- Page 565 and 566:
551 OPM PBOC PLA PMI PPI PPP PRC QD
- Page 567:
553 2016 COMMISSION STAFF MICHAEL R