- Page 2 and 3:
Journal of Chromatogaphy Library -
- Page 4 and 5:
Journal of Chromatography Library -
- Page 6 and 7:
Dedicated to Pr0f.Dr.h. A.I.M. Keul
- Page 8 and 9:
Contents Preface ..................
- Page 10 and 11:
CONTENTS IX 6.4.2. The d.c. method
- Page 12 and 13:
CONTENTS XI 12.2.2. Applications ..
- Page 14 and 15:
It is very well known that charged
- Page 16 and 17:
Chapter 1 Historical review SUMMARY
- Page 18 and 19:
HISTORICAL REVIEW 3 Independently i
- Page 20 and 21:
THEORY
- Page 22 and 23:
Chapter 2 Principles of electrophor
- Page 24 and 25:
MOVINGBOUNDARY ELECTROPHORESIS a S
- Page 26 and 27:
MOVINGBOUNDARY ELECTROPHORESIS 0 iu
- Page 28 and 29:
ISOTACHOPHORESIS 13 2.4. PRINCIPLE
- Page 30 and 31:
ISOTACHOPHORESIS 15 As the anionic
- Page 32 and 33:
ISOTACHOPHORESIS velocities, so tha
- Page 34 and 35:
ISOTACHOPHORESIS 19 d.t ’.t I Fig
- Page 36 and 37:
ISOTACHOPHORESIS 21 t Fig.2.8. Isot
- Page 38 and 39:
ISOELECTRIC FOCUSING 23 The four is
- Page 40 and 41:
DISCUSSION 25 Fig.2.11. Survey of t
- Page 42 and 43:
Chapter 3 Concept of mobility SUMMA
- Page 44 and 45:
IONIC MOBILITY AND IONIC EQUIVALENT
- Page 46 and 47:
EFFECTIVE IONIC MOBILITY 31 obtain
- Page 48 and 49:
EFFECTIVE IONIC MOBILITY 33 compari
- Page 50 and 51:
EFFECTIVE IONIC MOBILITY Fig.3.4. R
- Page 52 and 53:
DETERMINATION OF IONIC MOBILITIES 3
- Page 54 and 55:
DETERMINATION OF IONIC MOBILITIES 3
- Page 56 and 57:
Chapter 4 Mathematical model for is
- Page 58 and 59:
GENERAL EQUATIONS 43 anionic specie
- Page 60 and 61:
GENERAL EQUATIONS 4.2.1. Equilibriu
- Page 62 and 63:
GENERAL EQUATIONS 41 i Similar equa
- Page 64 and 65:
GENERAL EQUATIONS 49 Uthzone (U-llt
- Page 66 and 67:
GENERAL EQUATIONS 4.2.4. Modified O
- Page 68 and 69:
GENERAL EQUATIONS TABLE 4.2 REDUCED
- Page 70 and 71:
MATHEMATICAL MODEL FOR THE STEADY S
- Page 72 and 73:
MATHEMATICAL MODEL FOR THE STEADY S
- Page 74 and 75:
MATHEMATICAL MODEL FOR THE STEADY S
- Page 76 and 77:
MATHEMATICAL MODEL FOR THE STEADY S
- Page 78 and 79:
MATHEMATICAL MODEL FOR THE STEADY S
- Page 80 and 81:
MATHEMATICAL MODEL FOR THE STEADY S
- Page 82 and 83:
MATHEMATICAL MODEL FOR THE STEADY S
- Page 84 and 85:
VALIDITY OF THE ISOTACHOPHORETIC MO
- Page 86 and 87:
VALIDITY OF THE ISOTACHOPHORETIC MO
- Page 88 and 89:
VALIDITY OF THE ISOTACHOPHORETIC MO
- Page 90 and 91:
VALIDITY OF THE ISOTACHOPHORETIC MO
- Page 92 and 93:
CHECK OF THE ISOTACHOPHORETIC MODEL
- Page 94 and 95:
CHECK OF THE ISOTACHOPHORETIC MODEL
- Page 96 and 97:
REFERENCES 81 Fig.4.17. Relationshi
- Page 98 and 99:
Chapter 5 Choice of electrolyte sys
- Page 100 and 101:
CHOICE OF THE SOLVENT 85 In general
- Page 102 and 103:
CHOICE OF THE SOLVENT TABLE 5.2 THE
- Page 104 and 105:
CHOICE OF THE SOLVENT pH and pKvalu
- Page 106 and 107:
CHOICE OF THE SOLVENT 91 TABLE 5.4
- Page 108 and 109:
CHOICE OF THE pH OF THE LEADING ELE
- Page 110 and 111:
CHOICE OF THE pH OF THE LEADING ELE
- Page 112 and 113:
CHOICE OF THE TERMINATING AND LEADI
- Page 114 and 115:
ADDITIONS TO THE ELECTROLYTE SOLUTI
- Page 116 and 117:
EXAMPLES Choice of solvent. Can wat
- Page 118 and 119:
EXAMPLES 103 solvent, hoping that a
- Page 120 and 121:
EXAMPLES TABLE 5.11 STEP HEIGHTS OF
- Page 122 and 123:
EXAMPLES TABLE 5.12 STEP HEIGHTS OF
- Page 124 and 125:
Fig.5.9. Isotachopherograms of the
- Page 126 and 127:
EXAMPLES II 4 3 Fig.5.11. Isotachop
- Page 128 and 129:
REFERENCES 113 Example I. As exampl
- Page 130 and 131:
INSTRUMENTATION
- Page 132 and 133:
Chapter 6 Detection systems SUMMARY
- Page 134 and 135:
THERMOMETRIC RECORDING 6.1.3. Combi
- Page 136 and 137:
THERMOMETRIC RECORDING Potential gr
- Page 138 and 139:
THERMOMETRIC RECORDING /2 Fig.6.1.
- Page 140 and 141:
THERMOMETRIC RECORDING T t l Fig.6.
- Page 142 and 143:
THERMOMETRIC RECORDING 7 127 It-- I
- Page 144 and 145:
THERMOMETRIC RECORDING a concentrat
- Page 146 and 147:
HIGH-FREQUENCY CONDUCTIVITY DETECTI
- Page 148 and 149:
CONDUCTIVITY DETECTION 133 Fig.6.9.
- Page 150 and 151:
CONDUCTIVITY DETECTION 135 The d.c.
- Page 152 and 153:
CONDUCTIVITY DETECTION 137 Hi V 1kR
- Page 154 and 155:
CONDUCTIVITY DETECTION Fig.6.12. Co
- Page 156 and 157:
CONDUCTIVITY DETECTION Fig.6.14. Th
- Page 158 and 159:
CONDUCTIVITY DETECTION 143 6.4.4. T
- Page 160 and 161:
CONDUCTIVITY DETECTION 145 contact
- Page 162 and 163:
CONDUCTIVITY DETECTION 147 We can n
- Page 164 and 165: CONDUCTIVITY DETECTION 149 N.Y., U.
- Page 166 and 167: CONDUCTIVITY DETECTION 151 achieved
- Page 168 and 169: UV ABSORPTION METER 153 -_-.- +- R
- Page 170 and 171: UV ABSORPTION METER Fig.6.22. Contr
- Page 172 and 173: W ABSORPTION METER r +15V -15V Mod
- Page 174 and 175: W ABSORPTION METER 159 TABLE 6.4 PR
- Page 176 and 177: W ABSORPTION METER 230 240 2% m zm
- Page 178 and 179: to Mod (Fig 6.24) oscillator I sync
- Page 180 and 181: UV ABSORPTION METER 165 dicular to
- Page 182 and 183: Fig.6.31. Isotachopherograms for th
- Page 184 and 185: UV ABSORPTION METER 169 50 Fig.6.33
- Page 186 and 187: ADDITIVES TO THE ELECTROLYTES 171 6
- Page 188 and 189: ADDITIVES TO THE ELECTROLYTES 173 e
- Page 190 and 191: ADDITIVES TO THE ELECTROLYTES 175 a
- Page 192 and 193: ADDITIVES TO THE ELECTROLYTES 177 o
- Page 194 and 195: ADDITIVES TO THE ELECTROLYTES 179 d
- Page 196 and 197: ADDITIVES TO THE ELECTROLYTES 181 T
- Page 198 and 199: ADDITIVES TO THE ELECTROLYTES Fig.6
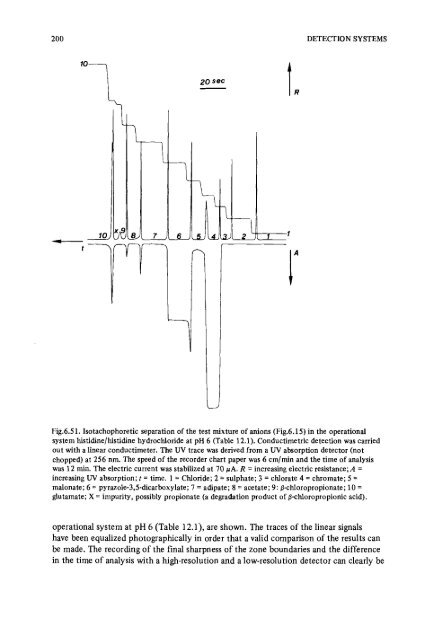
- Page 200 and 201: ADDITIVES TO THE ELECTROLYTES 185 F
- Page 202 and 203: ADDITIVES TO THE ELECTROLYTES 1 2 3
- Page 204 and 205: ADDITIVES TO THE ELECTROLYTES 189 n
- Page 206 and 207: COATING OF THE MICRO-SENSING ELECTR
- Page 208 and 209: DETECTION LIMITS 193 electric drivi
- Page 210 and 211: DETECTION LIMITS 195 Fig.6.48. Infl
- Page 212 and 213: DETECTION LIMITS 197 TABLE 6.6 SURV
- Page 216 and 217: REFERENCES 201 seen. Again it is cl
- Page 218 and 219: Chapter 7 Instrumentation SUMMARY T
- Page 220 and 221: INJECTION SYSTEMS I! I n Fig.7.1. P
- Page 222 and 223: INJECTION SYSTEMS Fig.7.3. Exploded
- Page 224 and 225: INJECTION SYSTEMS Fig.7.5. Injectio
- Page 226 and 227: COUNTER ELECTRODE COMPARTMENTS 21 1
- Page 228 and 229: COUNTER ELECTRODE COMPARTMENTS Even
- Page 230 and 231: COUNTER ELECTRODE COMPARTMENTS 21 5
- Page 232 and 233: EQUIPMENT the large bore, a more di
- Page 234 and 235: EQUIPMENT 219 belonging to three cl
- Page 236 and 237: EQUIPMENT 221 signal of the thermoc
- Page 238 and 239: EQUIF'MENT 223 No effect on the res
- Page 240 and 241: EQUIPMENT 225 Fig.7.14. Electrophor
- Page 242 and 243: EQUIPMENT Fig.7.16. Photograph of t
- Page 244 and 245: EQUIPMENT 229 mounted equiplanar, w
- Page 246 and 247: COUNTER FLOW OF ELECTROLYTE 231 ins
- Page 248 and 249: COUNTER FLOW OF ELECTROLYTE p High
- Page 250 and 251: COUNTER FLOW OF ELECTROLYTE Fig.7.2
- Page 252 and 253: COUNTER FLOW OF ELECTROLYTE 231 aro
- Page 254 and 255: COUNTER FLOW OF ELECTROLYTE p high
- Page 256 and 257: COUNTER FLOW OF ELECTROLYTE 24 1 7.
- Page 258 and 259: COUNTER FLOW OF ELECTROLYTE I I 31
- Page 260 and 261: COUNTER FLOW OF ELECTROLYTE max. 15
- Page 262 and 263: APPLICATIONS
- Page 264 and 265:
Chapter 8 Introduction SUMMARY In t
- Page 266 and 267:
INTRODUCTION 25 1 the various ionic
- Page 268 and 269:
Chapter 9 Practical aspects SUMMARY
- Page 270 and 271:
DISTURBANCES CAUSED BY H+ AND OH 25
- Page 272 and 273:
DISTURBANCES CAUSED BY H+ AND OH 25
- Page 274 and 275:
DISTURBANCES CAUSED BY H+ AND OH- 2
- Page 276 and 277:
DISTURBANCES CAUSED BY H+ AND OH 26
- Page 278 and 279:
DISTURBANCES DUE TO CO, 263 Electro
- Page 280 and 281:
ENFORCED ISOTACHOPHORESIS 265 t T T
- Page 282 and 283:
WATER AS TERMINATOR 267 function of
- Page 284 and 285:
PURIFICATION OF THE TERMINATOR 7 4
- Page 286 and 287:
REFERENCES 271 AS an example, the c
- Page 288 and 289:
Chapter 10 Quantitative aspects SUM
- Page 290 and 291:
THERMOMETRIC MEASUREMENTS 215 vj c
- Page 292 and 293:
THERMOMETRIC MEASUREMENTS TABLE 10.
- Page 294 and 295:
CONDUCTIMETRIC MEASUREMENTS factor
- Page 296 and 297:
CONCLUSION 28 1 Tables 10.3-10.5 wa
- Page 298 and 299:
Chapter 11 Separation of cationic s
- Page 300 and 301:
SEPARATION USING A THERMOCOUPLE AS
- Page 302 and 303:
SEPARATION USING A THERMOCOUPLE AS
- Page 304 and 305:
SEPARATION USING A THERMOCOUPLE AS
- Page 306 and 307:
I SEPARATION USING A THERMOCOUPLE A
- Page 308 and 309:
SEPARATION USING CONDUCTIVITY AND U
- Page 310 and 311:
Chapter I2 Separation of anionic sp
- Page 312 and 313:
SEPARATION USING A THERMOMETRIC DET
- Page 314 and 315:
SEPARATION USING A THERMOMETRIC DET
- Page 316 and 317:
SEPARATION USING CONDUCTIVITY AND W
- Page 318 and 319:
SEPARATION USING CONDUCTIVITY AND U
- Page 320 and 321:
SEPARATION USING CONDUCTIVITY AND U
- Page 322 and 323:
SEPARATION USING CONDUCTIVITY AND U
- Page 324 and 325:
SEPARATION USING CONDUCTIVITY AND U
- Page 326 and 327:
Chapter 13 Amino acids, peptides an
- Page 328 and 329:
AMINO ACIDS TABLE 13.1 OPERATIONAL
- Page 330 and 331:
AMINO ACIDS 8- ?- 6- 5- 4- 3- 2- f-
- Page 332 and 333:
AMINO ACIDS 317 TABLE 13.5 STEP HEI
- Page 334 and 335:
AMINO ACIDS Fig.13.3. Schematic dia
- Page 336 and 337:
AMINO ACIDS TABLE 13.6 DETERMINATIO
- Page 338 and 339:
SEPARATION OF PROTEINS IN AMPHOLYTE
- Page 340 and 341:
SEPARATION OF PROTEINS IN AMPHOLYTE
- Page 342 and 343:
SEPARATION OF PROTEINS IN AMPHOLYTE
- Page 344 and 345:
SEPARATION OF PROTEINS IN AMPHOLYTE
- Page 346 and 347:
SEPARATION OF PROTEINS IN AMPHOLYTE
- Page 348 and 349:
SEPARATION OF PROTEINS IN AMPHOLYTE
- Page 350 and 351:
SEPARATION OF SMALL PEPTIDES reprod
- Page 352 and 353:
Chapter I4 Separation of nucleotide
- Page 354 and 355:
SEPARATION USING A THERMOMETRIC DET
- Page 356 and 357:
SEPARATION USING A THERMOMETRIC DET
- Page 358 and 359:
SEPARATION USING CONDUCTIVITY AND U
- Page 360 and 361:
SEPARATION USING CONDUCTIVITY AND U
- Page 362 and 363:
Chapter 15 Enzymatic reactions SUMM
- Page 364 and 365:
ENZYMATIC CONVERSION OF GLUCOSE (FR
- Page 366 and 367:
ENZYMATIC CONVERSION OF GLUCOSE (FR
- Page 368 and 369:
ENZYMATIC CONVERSION OF GLUCOSE (FR
- Page 370 and 371:
ENZYMATIC CONVERSION OF PYRUVATE 35
- Page 372 and 373:
ENZYMATIC CONVERSION OF PYRUVATE 35
- Page 374 and 375:
ENZYMATIC CONVERSION OF PYRUVATE 35
- Page 376 and 377:
Chapter 16 Separations in non-aqueo
- Page 378 and 379:
SEPARATION OF ANIONIC SPECIES IN ME
- Page 380 and 381:
SEPARATION OF CATIONIC SPECIES IN M
- Page 382 and 383:
SEPARATION OF CATIONIC SPECIES IN M
- Page 384 and 385:
SEPARATION OF CATIONIC SPECIES IN M
- Page 386 and 387:
SEPARATION OF CATIONIC SPECIES IN M
- Page 388 and 389:
EXPERIMENTS IN AQUEOUS METHANOLIC S
- Page 390 and 391:
Chapter I7 Counter flow of electrol
- Page 392 and 393:
INTRODUCTION 317 In various operati
- Page 394 and 395:
EXPERIMENTAL 0% 10 % a b 60 % a b a
- Page 396 and 397:
EXPERIMENTAL 381 caused by the coun
- Page 398 and 399:
CONCLUSION 383 c t r ’r; I I"
- Page 400 and 401:
APPENDICES
- Page 402 and 403:
Appendix A Simplified model of movi
- Page 404 and 405:
PROCEDURE OF COMPUTATION A.3. PROCE
- Page 406 and 407:
EXPERIMENTAL 39 1 TABLE A1 THEORETI
- Page 408 and 409:
DISCUSSION E I I Fig.A2. Graphical
- Page 410 and 411:
Appendix B Diameter of the narrow-b
- Page 412 and 413:
Appendix C Literature 1897-1966 F.
- Page 414 and 415:
LITERATURE 399 B.P. Konstantinov an
- Page 416 and 417:
LITERATURE 401 1971 L. Arlinger, Is
- Page 418 and 419:
LITERATURE 403 1973 L. Arlinger and
- Page 420 and 421:
LITERATURE 405 A. Chrambach and J.S
- Page 422 and 423:
LITERATURE 407 M. Coxon and M.J. Bi
- Page 424 and 425:
Symbols and abbreviations SYMBOLS A
- Page 426 and 427:
SYMBOLS AND ABBREVIATIONS SUPERSCRI
- Page 428 and 429:
Subject index A Absorption meter, U
- Page 430 and 431:
SUBJECT INDEX 41 5 Detection limit
- Page 432 and 433:
SUBJECT INDEX 41 7 --_ , separation