- Page 3:
COMPOSITE MATERIALS RESEARCH PROGRE
- Page 6 and 7:
Copyright © 2008 by Nova Science P
- Page 8 and 9:
vi Contents Chapter 9 Recent Advanc
- Page 10 and 11:
viii Lucas P. Durand scale transiti
- Page 12 and 13:
x Lucas P. Durand machine. In paral
- Page 15 and 16:
In: Composite Materials Research Pr
- Page 17 and 18:
Multi-scale Analysis of Fiber-Reinf
- Page 19 and 20:
Multi-scale Analysis of Fiber-Reinf
- Page 21 and 22:
Multi-scale Analysis of Fiber-Reinf
- Page 23 and 24:
Multi-scale Analysis of Fiber-Reinf
- Page 25 and 26:
T300 fibers (Soden et al., 1998; Ag
- Page 27 and 28:
Multi-scale Analysis of Fiber-Reinf
- Page 29 and 30:
1 I L = L : r v Multi-scale Analysi
- Page 31 and 32:
Multi-scale Analysis of Fiber-Reinf
- Page 33 and 34:
Multi-scale Analysis of Fiber-Reinf
- Page 35 and 36:
Multi-scale Analysis of Fiber-Reinf
- Page 37 and 38:
I E ⎡0 ⎢ ⎢0 ⎢ ⎢ ⎢ ⎢0
- Page 39 and 40:
Multi-scale Analysis of Fiber-Reinf
- Page 41 and 42:
Multi-scale Analysis of Fiber-Reinf
- Page 43 and 44:
Multi-scale Analysis of Fiber-Reinf
- Page 45 and 46:
Multi-scale Analysis of Fiber-Reinf
- Page 47 and 48:
Multi-scale Analysis of Fiber-Reinf
- Page 49 and 50:
Multi-scale Analysis of Fiber-Reinf
- Page 51 and 52:
Applied macroscopic load Correspond
- Page 53 and 54:
Multi-scale Analysis of Fiber-Reinf
- Page 55 and 56:
Multi-scale Analysis of Fiber-Reinf
- Page 57 and 58:
Multi-scale Analysis of Fiber-Reinf
- Page 59 and 60:
Multi-scale Analysis of Fiber-Reinf
- Page 61 and 62:
Multi-scale Analysis of Fiber-Reinf
- Page 63 and 64:
Multi-scale Analysis of Fiber-Reinf
- Page 65 and 66:
In: Composite Materials Research Pr
- Page 67 and 68:
Optimization of Laminated Composite
- Page 69 and 70:
Optimization of Laminated Composite
- Page 71 and 72:
⎧σ x ⎫ ⎡ mE ⎪ ⎪ ⎢ x
- Page 73 and 74:
and γ 2 γ 0 Optimization of Lamin
- Page 75 and 76:
Optimization of Laminated Composite
- Page 77 and 78:
Optimization of Laminated Composite
- Page 79 and 80:
Optimization of Laminated Composite
- Page 81 and 82:
Optimization of Laminated Composite
- Page 83 and 84:
Optimization of Laminated Composite
- Page 85 and 86:
Optimization of Laminated Composite
- Page 87 and 88:
Optimization of Laminated Composite
- Page 89 and 90:
Optimization of Laminated Composite
- Page 91 and 92:
Optimization of Laminated Composite
- Page 93 and 94:
Optimization of Laminated Composite
- Page 95 and 96:
Optimization of Laminated Composite
- Page 97 and 98:
Optimization of Laminated Composite
- Page 99 and 100:
Optimization of Laminated Composite
- Page 101 and 102:
4 x 10 5 4 3 2 1 Compliance (Nmm) 0
- Page 103 and 104:
Optimization of Laminated Composite
- Page 105 and 106:
Optimization of Laminated Composite
- Page 107 and 108:
3.5 3 2.5 2 1.5 1 Optimization of L
- Page 109 and 110:
Optimization of Laminated Composite
- Page 111 and 112:
Optimization of Laminated Composite
- Page 113 and 114:
Optimization of Laminated Composite
- Page 115 and 116:
Optimization of Laminated Composite
- Page 117 and 118:
Optimization of Laminated Composite
- Page 119 and 120:
Optimization of Laminated Composite
- Page 121:
Optimization of Laminated Composite
- Page 124 and 125:
110 W.H. Zhong, R.G. Maguire, S.S.
- Page 126 and 127:
112 Reinforcement: Advanced materia
- Page 128 and 129:
114 W.H. Zhong, R.G. Maguire, S.S.
- Page 130 and 131:
116 W.H. Zhong, R.G. Maguire, S.S.
- Page 132 and 133:
118 W.H. Zhong, R.G. Maguire, S.S.
- Page 134 and 135:
120 W.H. Zhong, R.G. Maguire, S.S.
- Page 136 and 137:
122 W.H. Zhong, R.G. Maguire, S.S.
- Page 138 and 139:
124 W.H. Zhong, R.G. Maguire, S.S.
- Page 140 and 141:
126 W.H. Zhong, R.G. Maguire, S.S.
- Page 142 and 143:
128 W.H. Zhong, R.G. Maguire, S.S.
- Page 144 and 145:
130 Yuanxin Zhou, Hassan Mahfuz, Vi
- Page 146 and 147:
132 Yuanxin Zhou, Hassan Mahfuz, Vi
- Page 148 and 149: 134 Yuanxin Zhou, Hassan Mahfuz, Vi
- Page 150 and 151: 136 Yuanxin Zhou, Hassan Mahfuz, Vi
- Page 152 and 153: 138 Yuanxin Zhou, Hassan Mahfuz, Vi
- Page 154 and 155: 140 Heat Flow (W/g) Heat Flow (W/g)
- Page 156 and 157: 142 Yuanxin Zhou, Hassan Mahfuz, Vi
- Page 158 and 159: 144 Material Yuanxin Zhou, Hassan M
- Page 160 and 161: 146 SEM Analysis Yuanxin Zhou, Hass
- Page 162 and 163: 148 Yuanxin Zhou, Hassan Mahfuz, Vi
- Page 164 and 165: 150 Governing Equation For the fibe
- Page 166 and 167: 152 ⎧ UU = ⎨ ⎩ ⎧ UD = ⎨
- Page 168 and 169: 154 Yuanxin Zhou, Hassan Mahfuz, Vi
- Page 170 and 171: 156 Stress (MPa) 120 80 40 0 Yuanxi
- Page 172 and 173: 158 Yuanxin Zhou, Hassan Mahfuz, Vi
- Page 174 and 175: 160 Yuanxin Zhou, Hassan Mahfuz, Vi
- Page 176 and 177: 162 Yuanxin Zhou, Hassan Mahfuz, Vi
- Page 178 and 179: 164 Yuanxin Zhou, Hassan Mahfuz, Vi
- Page 180 and 181: 166 Giangiacomo Minak and Andrea Zu
- Page 182 and 183: 168 Giangiacomo Minak and Andrea Zu
- Page 184 and 185: 170 ⎟ ⎞ ⎠ s ⎜ ⎛ ⎝ = a E
- Page 186 and 187: 172 Giangiacomo Minak and Andrea Zu
- Page 188 and 189: 174 Giangiacomo Minak and Andrea Zu
- Page 190 and 191: 176 Giangiacomo Minak and Andrea Zu
- Page 192 and 193: 178 Giangiacomo Minak and Andrea Zu
- Page 194 and 195: 180 Giangiacomo Minak and Andrea Zu
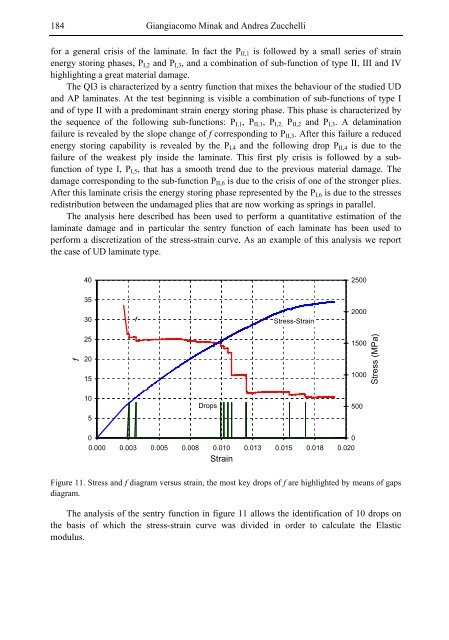
- Page 196 and 197: 182 Giangiacomo Minak and Andrea Zu
- Page 200 and 201: 186 Giangiacomo Minak and Andrea Zu
- Page 202 and 203: 188 A B E (MPa) D 250000 200000 150
- Page 204 and 205: 190 D D 1.0 0.9 0.8 0.7 0.6 0.5 0.4
- Page 206 and 207: 192 Giangiacomo Minak and Andrea Zu
- Page 208 and 209: 194 Giangiacomo Minak and Andrea Zu
- Page 210 and 211: 196 Giangiacomo Minak and Andrea Zu
- Page 212 and 213: 198 Giangiacomo Minak and Andrea Zu
- Page 214 and 215: 200 Giangiacomo Minak and Andrea Zu
- Page 216 and 217: 202 Giangiacomo Minak and Andrea Zu
- Page 218 and 219: 204 Conclusion Giangiacomo Minak an
- Page 220 and 221: 206 Giangiacomo Minak and Andrea Zu
- Page 223 and 224: In: Composite Materials Research Pr
- Page 225 and 226: Research Directions in the Fatigue
- Page 227 and 228: Research Directions in the Fatigue
- Page 229 and 230: Research Directions in the Fatigue
- Page 231 and 232: Research Directions in the Fatigue
- Page 233 and 234: Research Directions in the Fatigue
- Page 235 and 236: Research Directions in the Fatigue
- Page 237 and 238: Research Directions in the Fatigue
- Page 239 and 240: Research Directions in the Fatigue
- Page 241 and 242: Bending force [N] Research Directio
- Page 243 and 244: Research Directions in the Fatigue
- Page 245 and 246: Research Directions in the Fatigue
- Page 247 and 248: Research Directions in the Fatigue
- Page 249 and 250:
Research Directions in the Fatigue
- Page 251 and 252:
In: Composite Materials Research Pr
- Page 253 and 254:
Damage Variables in Impact Testing
- Page 255 and 256:
Damage Variables in Impact Testing
- Page 257 and 258:
Damage Variables in Impact Testing
- Page 259 and 260:
Damage Variables in Impact Testing
- Page 261 and 262:
Damage Variables in Impact Testing
- Page 263 and 264:
F peak [kN] 16 14 12 10 8 6 4 2 0 D
- Page 265 and 266:
Damage Variables in Impact Testing
- Page 267 and 268:
Damage Variables in Impact Testing
- Page 269 and 270:
Damage Variables in Impact Testing
- Page 271 and 272:
In: Composite Materials Research Pr
- Page 273 and 274:
Eletromechanical Field Concentratio
- Page 275 and 276:
Eletromechanical Field Concentratio
- Page 277 and 278:
Eletromechanical Field Concentratio
- Page 279 and 280:
Eletromechanical Field Concentratio
- Page 281 and 282:
Eletromechanical Field Concentratio
- Page 283 and 284:
MV/m. Eletromechanical Field Concen
- Page 285 and 286:
Eletromechanical Field Concentratio
- Page 287:
Eletromechanical Field Concentratio
- Page 290 and 291:
276 S.C. Tjong developed in the pas
- Page 292 and 293:
278 S.C. Tjong ultrasonic waves gen
- Page 294 and 295:
280 S.C. Tjong applications. Goujon
- Page 296 and 297:
282 S.C. Tjong nanoparticles were p
- Page 298 and 299:
284 S.C. Tjong where DL is lattice
- Page 300 and 301:
286 S.C. Tjong stress is temperatur
- Page 302 and 303:
288 S.C. Tjong threshold stress res
- Page 304 and 305:
290 S.C. Tjong NC Al, and the NC Al
- Page 306 and 307:
292 S.C. Tjong (a) (b) Figure 19. T
- Page 308 and 309:
294 S.C. Tjong Apart from forming u
- Page 310 and 311:
296 S.C. Tjong [29] Saravanan, M.;
- Page 312 and 313:
298 braids, 115 broadband, 211 bubb
- Page 314 and 315:
300 endothermic, 139 endurance, 32
- Page 316 and 317:
302 isostatic pressing, 279, 288 It
- Page 318 and 319:
304 piezoelectricity, 261 pitch, 12
- Page 320 and 321:
306 67, 69, 70, 71, 72, 73, 84, 94,