Dimensiones de la seguridad alimentaria : - Coneval
Dimensiones de la seguridad alimentaria : - Coneval
Dimensiones de la seguridad alimentaria : - Coneval

Create successful ePaper yourself
Turn your PDF publications into a flip-book with our unique Google optimized e-Paper software.
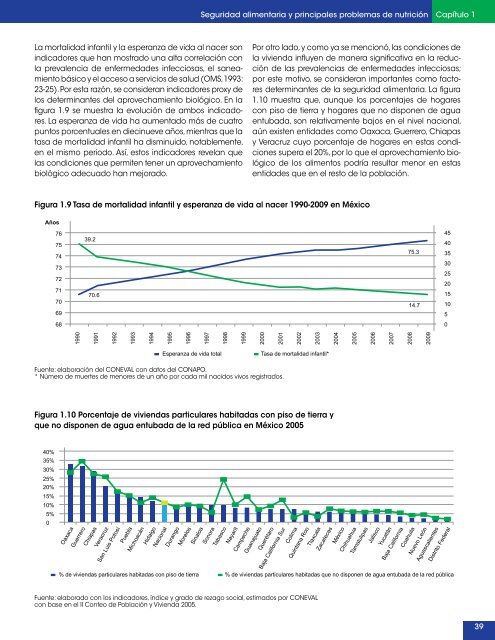
La mortalidad infantil y <strong>la</strong> esperanza <strong>de</strong> vida al nacer son<br />
indicadores que han mostrado una alta corre<strong>la</strong>ción con<br />
<strong>la</strong> prevalencia <strong>de</strong> enfermeda<strong>de</strong>s infecciosas, el saneamiento<br />
básico y el acceso a servicios <strong>de</strong> salud (OMS, 1993:<br />
23-25). Por esta razón, se consi<strong>de</strong>ran indicadores proxy <strong>de</strong><br />
los <strong>de</strong>terminantes <strong>de</strong>l aprovechamiento biológico. En <strong>la</strong><br />
figura 1.9 se muestra <strong>la</strong> evolución <strong>de</strong> ambos indicadores.<br />
La esperanza <strong>de</strong> vida ha aumentado más <strong>de</strong> cuatro<br />
puntos porcentuales en diecinueve años, mientras que <strong>la</strong><br />
tasa <strong>de</strong> mortalidad infantil ha disminuido, notablemente,<br />
en el mismo periodo. Así, estos indicadores reve<strong>la</strong>n que<br />
<strong>la</strong>s condiciones que permiten tener un aprovechamiento<br />
biológico a<strong>de</strong>cuado han mejorado.<br />
Años<br />
76<br />
75<br />
74<br />
73<br />
72<br />
71<br />
70<br />
69<br />
68<br />
1990<br />
39.2<br />
70.6<br />
1991<br />
1992<br />
1993<br />
1994<br />
Fuente: e<strong>la</strong>boración <strong>de</strong>l CONEVAL con datos <strong>de</strong>l CONAPO.<br />
* Número <strong>de</strong> muertes <strong>de</strong> menores <strong>de</strong> un año por cada mil nacidos vivos registrados.<br />
1995<br />
Seguridad <strong>alimentaria</strong> y principales problemas <strong>de</strong> nutrición<br />
Esperanza <strong>de</strong> vida total Tasa <strong>de</strong> mortalidad infantil*<br />
Fuente: e<strong>la</strong>borado con los indicadores, índice y grado <strong>de</strong> rezago social, estimados por CONEVAL<br />
con base en el II Conteo <strong>de</strong> Pob<strong>la</strong>ción y Vivienda 2005.<br />
1996<br />
1997<br />
1998<br />
1999<br />
Capítulo 1<br />
Por otro <strong>la</strong>do, y como ya se mencionó, <strong>la</strong>s condiciones <strong>de</strong><br />
<strong>la</strong> vivienda influyen <strong>de</strong> manera significativa en <strong>la</strong> reducción<br />
<strong>de</strong> <strong>la</strong>s prevalencias <strong>de</strong> enfermeda<strong>de</strong>s infecciosas;<br />
por este motivo, se consi<strong>de</strong>ran importantes como factores<br />
<strong>de</strong>terminantes <strong>de</strong> <strong>la</strong> <strong>seguridad</strong> <strong>alimentaria</strong>. La figura<br />
1.10 muestra que, aunque los porcentajes <strong>de</strong> hogares<br />
con piso <strong>de</strong> tierra y hogares que no disponen <strong>de</strong> agua<br />
entubada, son re<strong>la</strong>tivamente bajos en el nivel nacional,<br />
aún existen entida<strong>de</strong>s como Oaxaca, Guerrero, Chiapas<br />
y Veracruz cuyo porcentaje <strong>de</strong> hogares en estas condiciones<br />
supera el 20%, por lo que el aprovechamiento biológico<br />
<strong>de</strong> los alimentos podría resultar menor en estas<br />
entida<strong>de</strong>s que en el resto <strong>de</strong> <strong>la</strong> pob<strong>la</strong>ción.<br />
Figura 1.9 Tasa <strong>de</strong> mortalidad infantil y esperanza <strong>de</strong> vida al nacer 1990-2009 en México<br />
Figura 1.10 Porcentaje <strong>de</strong> viviendas particu<strong>la</strong>res habitadas con piso <strong>de</strong> tierra y<br />
que no disponen <strong>de</strong> agua entubada <strong>de</strong> <strong>la</strong> red pública en México 2005<br />
40%<br />
35%<br />
30%<br />
25%<br />
20%<br />
15%<br />
10%<br />
5%<br />
0<br />
Oaxaca<br />
Guerrero<br />
Chiapas<br />
Veracruz<br />
San Luis Potosí<br />
Pueb<strong>la</strong><br />
Michoacán<br />
Hidalgo<br />
Nacional<br />
Durango<br />
Morelos<br />
Sinaloa<br />
Sonora<br />
Tabasco<br />
Nayarit<br />
Campeche<br />
Guanajuato<br />
Querétaro<br />
Baja California Sur<br />
Colima<br />
Quintana Roo<br />
T<strong>la</strong>xca<strong>la</strong><br />
Zacatecas<br />
México<br />
Chihuahua<br />
Tamalulipas<br />
Jalisco<br />
Yucatán<br />
Baja California<br />
Coahui<strong>la</strong><br />
Nuevo León<br />
Aguascalientes<br />
Distrito Fe<strong>de</strong>ral<br />
% <strong>de</strong> viviendas particu<strong>la</strong>res habitadas con piso <strong>de</strong> tierra % <strong>de</strong> viviendas particu<strong>la</strong>res habitadas que no disponen <strong>de</strong> agua entubada <strong>de</strong> <strong>la</strong> red pública<br />
2000<br />
2001<br />
2002<br />
2003<br />
2004<br />
2005<br />
2006<br />
2007<br />
75.3<br />
14.7<br />
2008<br />
2009<br />
45<br />
40<br />
35<br />
30<br />
25<br />
20<br />
15<br />
10<br />
5<br />
0<br />
39