Dimensiones de la seguridad alimentaria : - Coneval
Dimensiones de la seguridad alimentaria : - Coneval
Dimensiones de la seguridad alimentaria : - Coneval

You also want an ePaper? Increase the reach of your titles
YUMPU automatically turns print PDFs into web optimized ePapers that Google loves.
84<br />
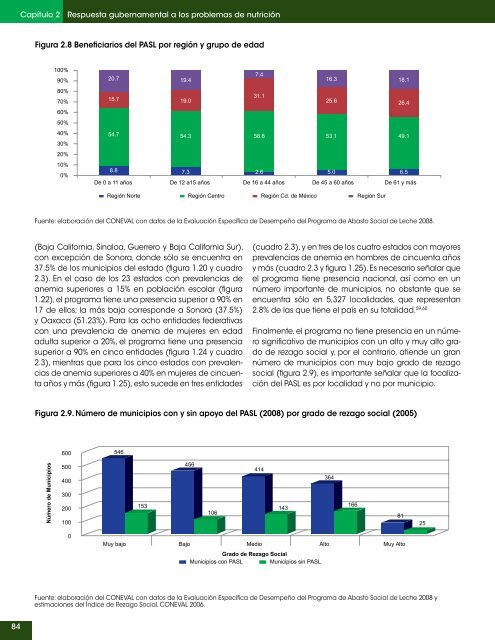
Capítulo 2 Respuesta gubernamental a los problemas <strong>de</strong> nutrición<br />
Figura 2.8 Beneficiarios <strong>de</strong>l PASL por región y grupo <strong>de</strong> edad<br />
100%<br />
90%<br />
80%<br />
70%<br />
60%<br />
50%<br />
40%<br />
30%<br />
20%<br />
10%<br />
0%<br />
20.7<br />
15.7<br />
54.7<br />
19.4<br />
19.0<br />
54.3<br />
8.8<br />
7.3<br />
2.6<br />
5.0<br />
6.5<br />
De 0 a 11 años De 12 a15 años De 16 a 44 años De 45 a 60 años De 61 y más<br />
Región Norte Región Centro Región Cd. <strong>de</strong> México Región Sur<br />
Fuente: e<strong>la</strong>boración <strong>de</strong>l CONEVAL con datos <strong>de</strong> <strong>la</strong> Evaluación Específica <strong>de</strong> Desempeño <strong>de</strong>l Programa <strong>de</strong> Abasto Social <strong>de</strong> Leche 2008.<br />
(Baja California, Sinaloa, Guerrero y Baja California Sur),<br />
con excepción <strong>de</strong> Sonora, don<strong>de</strong> sólo se encuentra en<br />
37.5% <strong>de</strong> los municipios <strong>de</strong>l estado (figura 1.20 y cuadro<br />
2.3). En el caso <strong>de</strong> los 23 estados con prevalencias <strong>de</strong><br />
anemia superiores a 15% en pob<strong>la</strong>ción esco<strong>la</strong>r (figura<br />
1.22), el programa tiene una presencia superior a 90% en<br />
17 <strong>de</strong> ellos; <strong>la</strong> más baja correspon<strong>de</strong> a Sonora (37.5%)<br />
y Oaxaca (51.23%). Para <strong>la</strong>s ocho entida<strong>de</strong>s fe<strong>de</strong>rativas<br />
con una prevalencia <strong>de</strong> anemia <strong>de</strong> mujeres en edad<br />
adulta superior a 20%, el programa tiene una presencia<br />
superior a 90% en cinco entida<strong>de</strong>s (figura 1.24 y cuadro<br />
2.3), mientras que para los cinco estados con prevalencias<br />
<strong>de</strong> anemia superiores a 40% en mujeres <strong>de</strong> cincuenta<br />
años y más (figura 1.25), esto suce<strong>de</strong> en tres entida<strong>de</strong>s<br />
(cuadro 2.3), y en tres <strong>de</strong> los cuatro estados con mayores<br />
prevalencias <strong>de</strong> anemia en hombres <strong>de</strong> cincuenta años<br />
y más (cuadro 2.3 y figura 1.25). Es necesario seña<strong>la</strong>r que<br />
el programa tiene presencia nacional, así como en un<br />
número importante <strong>de</strong> municipios, no obstante que se<br />
encuentra sólo en 5,327 localida<strong>de</strong>s, que representan<br />
2.8% <strong>de</strong> <strong>la</strong>s que tiene el país en su totalidad. 59,60<br />
Finalmente, el programa no tiene presencia en un número<br />
significativo <strong>de</strong> municipios con un alto y muy alto grado<br />
<strong>de</strong> rezago social y, por el contrario, atien<strong>de</strong> un gran<br />
número <strong>de</strong> municipios con muy bajo grado <strong>de</strong> rezago<br />
social (figura 2.9), es importante seña<strong>la</strong>r que <strong>la</strong> focalización<br />
<strong>de</strong>l PASL es por localidad y no por municipio.<br />
Figura 2.9. Número <strong>de</strong> municipios con y sin apoyo <strong>de</strong>l PASL (2008) por grado <strong>de</strong> rezago social (2005)<br />
Número <strong>de</strong> Municipios<br />
600<br />
500<br />
400<br />
300<br />
200<br />
100<br />
0<br />
546<br />
Muy bajo<br />
153<br />
456<br />
106<br />
Fuente: e<strong>la</strong>boración <strong>de</strong>l CONEVAL con datos <strong>de</strong> <strong>la</strong> Evaluación Específica <strong>de</strong> Desempeño <strong>de</strong>l Programa <strong>de</strong> Abasto Social <strong>de</strong> Leche 2008 y<br />
estimaciones <strong>de</strong>l Índice <strong>de</strong> Rezago Social, CONEVAL 2006.<br />
7.4<br />
31.1<br />
58.8<br />
414<br />
143<br />
Bajo<br />
Medio<br />
Grado <strong>de</strong> Rezago Social<br />
Alto Muy Alto<br />
Municipios con PASL Municipios sin PASL<br />
16.3<br />
25.6<br />
53.1<br />
364<br />
166<br />
18.1<br />
26.4<br />
49.1<br />
81<br />
25