ESTADO DE LAS CIUDADES ESTADO DE LAS CIUDADES
ESTADO DE LAS CIUDADES ESTADO DE LAS CIUDADES
ESTADO DE LAS CIUDADES ESTADO DE LAS CIUDADES
Create successful ePaper yourself
Turn your PDF publications into a flip-book with our unique Google optimized e-Paper software.
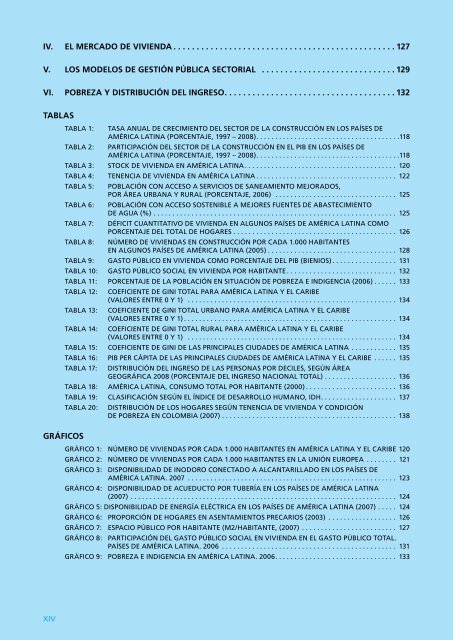
IV. EL MERCADO <strong>DE</strong> VIVIENDA.. . . . . . . . . . . . . . . . . . . . . . . . . . . . . . . . . . . . . . . . . . . . . . . 127<br />
V. LOS MO<strong>DE</strong>LOS <strong>DE</strong> GESTIÓN PÚBLICA SECTORIAL .. . . . . . . . . . . . . . . . . . . . . . . . . . . . 129<br />
VI. POBREZA Y DISTRIBUCIÓN <strong>DE</strong>L INGRESO. . . . . . . . . . . . . . . . . . . . . . . . . . . . . . . . . . . . 132<br />
Tablas<br />
Tabla 1:<br />
Tabla 2:<br />
Tasa anual de crecimiento del sector de la construcción en los países de<br />
América Latina (Porcentaje, 1997 – 2008). . . . . . . . . . . . . . . . . . . . . . . . . . . . . . . . . . . . . 118<br />
Participación del sector de la construcción en el PIB en los países de<br />
América Latina (Porcentaje, 1997 – 2008). . . . . . . . . . . . . . . . . . . . . . . . . . . . . . . . . . . . . 118<br />
Tabla 3: Stock de vivienda en América Latina.. . . . . . . . . . . . . . . . . . . . . . . . . . . . . . . . . . . . . . . . 120<br />
Tabla 4: Tenencia de vivienda en América Latina.. . . . . . . . . . . . . . . . . . . . . . . . . . . . . . . . . . . . . 122<br />
Tabla 5:<br />
Tabla 6:<br />
Tabla 7:<br />
Tabla 8:<br />
Población con acceso a servicios de saneamiento mejorados,<br />
por área urbana y rural (Porcentaje, 2006) .. . . . . . . . . . . . . . . . . . . . . . . . . . . . . . . . 125<br />
Población con acceso sostenible a mejores fuentes de abastecimiento<br />
de agua (%).. . . . . . . . . . . . . . . . . . . . . . . . . . . . . . . . . . . . . . . . . . . . . . . . . . . . . . . . . . . . . . . . 125<br />
Déficit cuantitativo de vivienda en algunos países de América Latina como<br />
porcentaje del total de hogares.. . . . . . . . . . . . . . . . . . . . . . . . . . . . . . . . . . . . . . . . . . . 126<br />
Número de viviendas en construcción por cada 1.000 habitantes<br />
en algunos países de América Latina (2005).. . . . . . . . . . . . . . . . . . . . . . . . . . . . . . . . . . 128<br />
Tabla 9: Gasto público en vivienda como porcentaje del PIB (Bienios).. . . . . . . . . . . . . . . . . 131<br />
Tabla 10: Gasto público social en vivienda por habitante.. . . . . . . . . . . . . . . . . . . . . . . . . . . . . 132<br />
Tabla 11: Porcentaje de la población en situación de pobreza e indigencia (2006).. . . . . . 133<br />
TABLA 12:<br />
Tabla 13:<br />
Tabla 14:<br />
Coeficiente de Gini Total para América Latina y El Caribe<br />
(VALORES ENTRE 0 y 1) .. . . . . . . . . . . . . . . . . . . . . . . . . . . . . . . . . . . . . . . . . . . . . . . . . . . . . . . 134<br />
Coeficiente de Gini Total URBANO para América Latina y El Caribe<br />
(VALORES ENTRE 0 y 1).. . . . . . . . . . . . . . . . . . . . . . . . . . . . . . . . . . . . . . . . . . . . . . . . . . . . . . . . 134<br />
Coeficiente de Gini Total Rural para América Latina y El Caribe<br />
(VALORES ENTRE 0 y 1) .. . . . . . . . . . . . . . . . . . . . . . . . . . . . . . . . . . . . . . . . . . . . . . . . . . . . . . . 134<br />
Tabla 15: Coeficiente de GINI de las principales ciudades de América Latina .. . . . . . . . . . . . 135<br />
Tabla 16: PIB per cápita de las principales ciudades de América Latina y el Caribe .. . . . . . 135<br />
Tabla 17:<br />
Distribución del ingreso de las personas por deciles, según área<br />
geográfica 2008 (Porcentaje del ingreso nacional total).. . . . . . . . . . . . . . . . . . . 136<br />
Tabla 18: América Latina, consumo total por habitante (2000).. . . . . . . . . . . . . . . . . . . . . . . . 136<br />
Tabla 19: Clasificación según el Índice de Desarrollo Humano, IDH. . . . . . . . . . . . . . . . . . . . 137<br />
Tabla 20:<br />
Distribución de los hogares según tenencia de vivienda y condición<br />
de pobreza en Colombia (2007) . . . . . . . . . . . . . . . . . . . . . . . . . . . . . . . . . . . . . . . . . . . . . . 138<br />
Gráficos<br />
Gráfico 1: Número de viviendas por cada 1.000 habitantes en América Latina y el Caribe.120<br />
Gráfico 2: Número de viviendas por cada 1.000 habitantes en la Unión Europea .. . . . . . . . 121<br />
Gráfico 3: Disponibilidad de inodoro conectado a alcantarillado en los países de<br />
América Latina. 2007 .. . . . . . . . . . . . . . . . . . . . . . . . . . . . . . . . . . . . . . . . . . . . . . . . . . . . . . . 123<br />
Gráfico 4: Disponibilidad de acueducto por tubería en los países de América Latina<br />
(2007).. . . . . . . . . . . . . . . . . . . . . . . . . . . . . . . . . . . . . . . . . . . . . . . . . . . . . . . . . . . . . . . . . . . . . . 124<br />
GRÁFICO 5: DISPONIBILIDAD de energía eléctrica en los países de América Latina (2007) . . . . . 124<br />
Gráfico 6: Proporción de hogares en asentamientos precarios (2003) .. . . . . . . . . . . . . . . . . . 126<br />
Gráfico 7: Espacio público por habitante (m2/habitante, (2007) .. . . . . . . . . . . . . . . . . . . . . . . . . 127<br />
Gráfico 8: Participación del gasto público social en vivienda en el gasto público total.<br />
Países de América Latina. 2006 .. . . . . . . . . . . . . . . . . . . . . . . . . . . . . . . . . . . . . . . . . . . . . . 131<br />
Gráfico 9: Pobreza e indigencia en América Latina. 2006. . . . . . . . . . . . . . . . . . . . . . . . . . . . . . . . 133<br />
XIV





![GuÃa del Usuario ] - Governance Assessment Portal](https://img.yumpu.com/44740603/1/190x253/gua-a-del-usuario-governance-assessment-portal.jpg?quality=85)
