ESTADO DE LAS CIUDADES ESTADO DE LAS CIUDADES
ESTADO DE LAS CIUDADES ESTADO DE LAS CIUDADES
ESTADO DE LAS CIUDADES ESTADO DE LAS CIUDADES

Create successful ePaper yourself
Turn your PDF publications into a flip-book with our unique Google optimized e-Paper software.
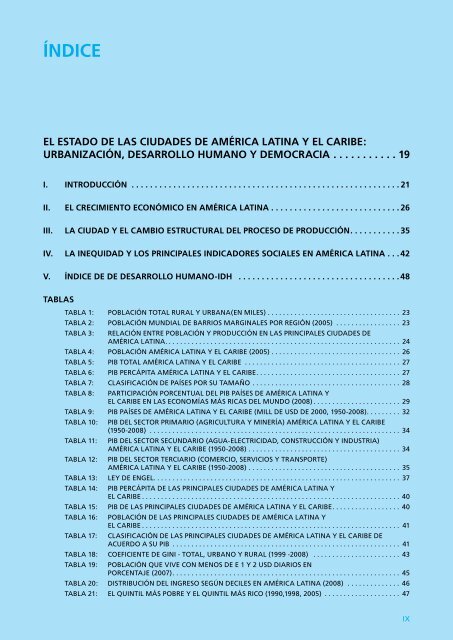
Índice<br />
El estado de las ciudades de américa latina y el caribe:<br />
URBANIZACIÓN, <strong>DE</strong>SARROLLO HUMANO Y <strong>DE</strong>MOCRACIA.. . . . . . . . . . 19<br />
I. Introducción .. . . . . . . . . . . . . . . . . . . . . . . . . . . . . . . . . . . . . . . . . . . . . . . . . . . . . . . . . 21<br />
II. El crecimiento Económico en América Latina . . . . . . . . . . . . . . . . . . . . . . . . . . . 26<br />
III. La ciudad y el Cambio Estructural del Proceso de Producción. . . . . . . . . . 35<br />
IV. La Inequidad y los Principales Indicadores Sociales en América Latina . . 42<br />
V. Índice de de Desarrollo Humano-IDH .. . . . . . . . . . . . . . . . . . . . . . . . . . . . . . . . . . 48<br />
Tablas<br />
Tabla 1: Población total rural y urbana(En Miles).. . . . . . . . . . . . . . . . . . . . . . . . . . . . . . . . . . . 23<br />
Tabla 2: Población Mundial de Barrios Marginales por Región (2005) .. . . . . . . . . . . . . . . . . 23<br />
Tabla 3:<br />
Relación entre población y producción en las principales ciudades de<br />
América Latina... . . . . . . . . . . . . . . . . . . . . . . . . . . . . . . . . . . . . . . . . . . . . . . . . . . . . . . . . . . . . 24<br />
Tabla 4: Población América Latina y el Caribe (2005).. . . . . . . . . . . . . . . . . . . . . . . . . . . . . . . . . . 26<br />
Tabla 5: PIB total América Latina y el Caribe .. . . . . . . . . . . . . . . . . . . . . . . . . . . . . . . . . . . . . . . . . 27<br />
Tabla 6: PIB percápita América latina y el Caribe. . . . . . . . . . . . . . . . . . . . . . . . . . . . . . . . . . . . . . 27<br />
Tabla 7: Clasificación de países por su tamaño.. . . . . . . . . . . . . . . . . . . . . . . . . . . . . . . . . . . . . . . 28<br />
Tabla 8:<br />
Participación Porcentual del PIB Países de América Latina y<br />
El Caribe en las economías más ricas <strong>DE</strong>L mundo (2008).. . . . . . . . . . . . . . . . . . . . . . . 29<br />
Tabla 9: PIB Países de América Latina y El Caribe (Mill de USD <strong>DE</strong> 2000, 1950-2008). . . . . . . . . 32<br />
Tabla 10:<br />
Tabla 11:<br />
tabla 12:<br />
PIB del Sector Primario (Agricultura y minería) América Latina y El Caribe<br />
(1950-2008) .. . . . . . . . . . . . . . . . . . . . . . . . . . . . . . . . . . . . . . . . . . . . . . . . . . . . . . . . . . . . . . . . . . 34<br />
PIB del sector secundario (agua-electricidad, construcción y Industria)<br />
América Latina y el Caribe (1950-2008).. . . . . . . . . . . . . . . . . . . . . . . . . . . . . . . . . . . . . . . . 34<br />
PIB del sector terciario (Comercio, servicios y transporte)<br />
América Latina y el Caribe (1950-2008).. . . . . . . . . . . . . . . . . . . . . . . . . . . . . . . . . . . . . . . . 35<br />
Tabla 13: Ley <strong>DE</strong> Engel. . . . . . . . . . . . . . . . . . . . . . . . . . . . . . . . . . . . . . . . . . . . . . . . . . . . . . . . . . . . . . . . . 37<br />
tabla 14:<br />
PIB percápita de las principales ciudades de América Latina y<br />
el Caribe.. . . . . . . . . . . . . . . . . . . . . . . . . . . . . . . . . . . . . . . . . . . . . . . . . . . . . . . . . . . . . . . . . . . . 40<br />
Tabla 15: PIB de las principales ciudades de América Latina y El Caribe. . . . . . . . . . . . . . . . . . 40<br />
tabla 16:<br />
tabla 17:<br />
Población de las principales ciudades de América Latina y<br />
El Caribe.. . . . . . . . . . . . . . . . . . . . . . . . . . . . . . . . . . . . . . . . . . . . . . . . . . . . . . . . . . . . . . . . . . . . 41<br />
Clasificación de las Principales Ciudades de América Latina y El Caribe de<br />
acuerdo a su PIB .. . . . . . . . . . . . . . . . . . . . . . . . . . . . . . . . . . . . . . . . . . . . . . . . . . . . . . . . . . . . 41<br />
Tabla 18: Coeficiente de Gini - Total, Urbano y Rural (1999 -2008) .. . . . . . . . . . . . . . . . . . . . . . . 43<br />
Tabla 19:<br />
Población que vive con menos de E 1 y 2 USD Diarios En<br />
porcentaje (2007). . . . . . . . . . . . . . . . . . . . . . . . . . . . . . . . . . . . . . . . . . . . . . . . . . . . . . . . . . . . 45<br />
Tabla 20: Distribución del Ingreso según deciles en América Latina (2008) .. . . . . . . . . . . . . . 46<br />
Tabla 21: El Quintil más Pobre y El quintil más Rico (1990,1998, 2005) .. . . . . . . . . . . . . . . . . . . . 47<br />
IX


![GuÃa del Usuario ] - Governance Assessment Portal](https://img.yumpu.com/44740603/1/190x253/gua-a-del-usuario-governance-assessment-portal.jpg?quality=85)