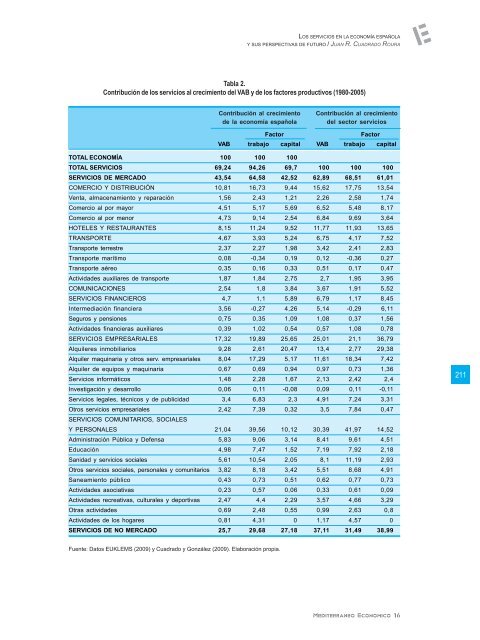
EL FUTURO DE LA ECONOMÍA ESPAÑOLALa Tab<strong>la</strong> 1 adjunta muestra los crecimientos <strong>de</strong> <strong>la</strong> productividad referidos a distintosperíodos por parte <strong>de</strong> los gran<strong>de</strong>s sectores <strong>de</strong> <strong>la</strong> economía españo<strong>la</strong>, así como <strong>la</strong>s variacionesque se obtienen en cuanto al crecimiento <strong>de</strong> <strong>la</strong> productividad por parte <strong>de</strong> <strong>la</strong>s distintas ramas<strong>de</strong> servicios.Los datos muestran c<strong>la</strong>ramente que <strong>la</strong> productividad <strong>de</strong> los servicios como agregado haexperimentado siempre un crecimiento muy reducido e incluso nulo (como ocurrió para el conjunto<strong>de</strong> los 90) y <strong>de</strong> ello pue<strong>de</strong> inferirse c<strong>la</strong>ramente que su contribución a <strong>la</strong> mejora <strong>de</strong> <strong>la</strong>productividad <strong>de</strong> <strong>la</strong> economía como conjunto ha sido siempre muy baja, compensando en negativo<strong>la</strong>s mejoras que registraron <strong>la</strong> industria y <strong>de</strong>l sector primario.Sin embargo, como muestran también algunas <strong>de</strong> <strong>la</strong>s cifras correspondientes a <strong>la</strong>s ramas<strong>de</strong> servicios que se recogen en <strong>la</strong> citada tab<strong>la</strong>, al comparar los datos por ramas terciarias seobservan notables diferencias entre el<strong>la</strong>s puesto que mientras algunas obtienen indicadores <strong>de</strong>productividad que generalmente son muy bajos (hostelería, comercio, otros servicios, sanidad yeducación, p. ej.), otras alcanzan tasas comparativamente altas (transportes, comunicaciones yservicios financieros).210Varios trabajos recientes han <strong>de</strong>stacado tanto a esca<strong>la</strong> internacional (Oulton, 2001; Wolf,2003 y Maroto y Cuadrado, 2009, entre otros) como para el caso español o en su comparacióncon otras economías (Maroto y Cuadrado, 2006 y Maroto, 2008) que «<strong>de</strong>ntro» <strong>de</strong>l sector servicioses posible observar comportamientos muy diversos en re<strong>la</strong>ción con <strong>la</strong> productividad, ya quemientras algunas activida<strong>de</strong>s refrendan <strong>la</strong> tesis <strong>de</strong> que <strong>la</strong>s variaciones <strong>de</strong> este indicador son muyreducidas, en otros casos los indicadores <strong>de</strong> <strong>la</strong> productividad por ramas evi<strong>de</strong>ncian que algunas<strong>de</strong> el<strong>la</strong>s han registrado aumentos bastante altos, con frecuencia comparables o incluso superioresa los <strong>de</strong> <strong>la</strong>s manufacturas. Se trata, generalmente, <strong>de</strong> activida<strong>de</strong>s don<strong>de</strong> <strong>la</strong> incorporación <strong>de</strong>los avances tecnológicos y <strong>la</strong> sustitución <strong>de</strong>l empleo por capital son viables y resultan inclusoimprescindibles para que <strong>la</strong> eficiencia <strong>de</strong> <strong>la</strong>s empresas que operan en dichas ramas puedanlograr altos niveles <strong>de</strong> eficiencia. La conclusión final no es, por supuesto, negar vali<strong>de</strong>z a <strong>la</strong> tesis<strong>de</strong> que los servicios tienen tasas <strong>de</strong> variación <strong>de</strong> <strong>la</strong> productividad bastante bajas –aunque habríaque consi<strong>de</strong>rar, asimismo, cómo <strong>de</strong>be medirse dicha productividad en el caso <strong>de</strong> <strong>la</strong>s ramasterciarias–, pero sí que <strong>de</strong>be ponerse en cuestión <strong>la</strong> pertinencia <strong>de</strong> esta i<strong>de</strong>a referida a todos losservicios, puesto que los datos muestran una variedad <strong>de</strong> comportamientos bastante significativa.<strong>El</strong> tercer rasgo general que parece necesario seña<strong>la</strong>r también en re<strong>la</strong>ción con <strong>la</strong> expansión<strong>de</strong> los servicios en <strong>la</strong> economía españo<strong>la</strong> es <strong>la</strong> heterogeneidad <strong>de</strong> comportamientos quemuestran sus distintas ramas. En otras pa<strong>la</strong>bras, ni todas <strong>la</strong>s ramas <strong>de</strong> actividad crecen a unritmo alto, ni por supuesto obtienen tasas <strong>de</strong> variación comparables. Analizando los datos correspondientesa un período suficientemente extenso como el que discurre entre 1980 y 2005 4 ,4La elección <strong>de</strong> este período viene dada por <strong>la</strong> disponibilidad <strong>de</strong> datos homogéneos que proce<strong>de</strong>n <strong>de</strong> <strong>la</strong> base EU KLEMS, e<strong>la</strong>boradapara un amplio número <strong>de</strong> países –entre ellos España– con el apoyo <strong>de</strong> <strong>la</strong> Unión Europea. Dicha base sólo alcanza hasta finales<strong>de</strong> 2005 y tiene <strong>la</strong> ventaja <strong>de</strong> que pue<strong>de</strong>n efectuarse comparaciones entre distintas economías.
LOS SERVICIOS EN LA ECONOMÍA ESPAÑOLAY SUS PERSPECTIVAS DE FUTURO / JUAN R. CUADRADO ROURATab<strong>la</strong> 2.Contribución <strong>de</strong> los servicios al crecimiento <strong>de</strong>l VAB y <strong>de</strong> los factores productivos (1980-2005)Contribución al crecimiento<strong>de</strong> <strong>la</strong> economía españo<strong>la</strong>Contribución al crecimiento<strong>de</strong>l sector serviciosFactorFactorVAB trabajo capital VAB trabajo capitalTOTAL ECONOMÍA 100 100 100TOTAL SERVICIOS 69,24 94,26 69,7 100 100 100SERVICIOS DE MERCADO 43,54 64,58 42,52 62,89 68,51 61,01COMERCIO Y DISTRIBUCIÓN 10,81 16,73 9,44 15,62 17,75 13,54Venta, almacenamiento y reparación 1,56 2,43 1,21 2,26 2,58 1,74Comercio al por mayor 4,51 5,17 5,69 6,52 5,48 8,17Comercio al por menor 4,73 9,14 2,54 6,84 9,69 3,64HOTELES Y RESTAURANTES 8,15 11,24 9,52 11,77 11,93 13,65TRANSPORTE 4,67 3,93 5,24 6,75 4,17 7,52Transporte terrestre 2,37 2,27 1,98 3,42 2,41 2,83Transporte marítimo 0,08 -0,34 0,19 0,12 -0,36 0,27Transporte aéreo 0,35 0,16 0,33 0,51 0,17 0,47Activida<strong>de</strong>s auxiliares <strong>de</strong> transporte 1,87 1,84 2,75 2,7 1,95 3,95COMUNICACIONES 2,54 1,8 3,84 3,67 1,91 5,52SERVICIOS FINANCIEROS 4,7 1,1 5,89 6,79 1,17 8,45Intermediación financiera 3,56 -0,27 4,26 5,14 -0,29 6,11Seguros y pensiones 0,75 0,35 1,09 1,08 0,37 1,56Activida<strong>de</strong>s financieras auxiliares 0,39 1,02 0,54 0,57 1,08 0,78SERVICIOS EMPRESARIALES 17,32 19,89 25,65 25,01 21,1 36,79Alquileres inmobiliarios 9,28 2,61 20,47 13,4 2,77 29,38Alquiler maquinaria y otros serv. empresariales 8,04 17,29 5,17 11,61 18,34 7,42Alquiler <strong>de</strong> equipos y maquinaria 0,67 0,69 0,94 0,97 0,73 1,36Servicios informáticos 1,48 2,28 1,67 2,13 2,42 2,4Investigación y <strong>de</strong>sarrollo 0,06 0,11 -0,08 0,09 0,11 -0,11Servicios legales, técnicos y <strong>de</strong> publicidad 3,4 6,83 2,3 4,91 7,24 3,31Otros servicios empresariales 2,42 7,39 0,32 3,5 7,84 0,47SERVICIOS COMUNITARIOS, SOCIALESY PERSONALES 21,04 39,56 10,12 30,39 41,97 14,52Administración Pública y Defensa 5,83 9,06 3,14 8,41 9,61 4,51Educación 4,98 7,47 1,52 7,19 7,92 2,18Sanidad y servicios sociales 5,61 10,54 2,05 8,1 11,19 2,93Otros servicios sociales, personales y comunitarios 3,82 8,18 3,42 5,51 8,68 4,91Saneamiento público 0,43 0,73 0,51 0,62 0,77 0,73Activida<strong>de</strong>s asociativas 0,23 0,57 0,06 0,33 0,61 0,09Activida<strong>de</strong>s recreativas, culturales y <strong>de</strong>portivas 2,47 4,4 2,29 3,57 4,66 3,29Otras activida<strong>de</strong>s 0,69 2,48 0,55 0,99 2,63 0,8Activida<strong>de</strong>s <strong>de</strong> los hogares 0,81 4,31 0 1,17 4,57 0SERVICIOS DE NO MERCADO 25,7 29,68 27,18 37,11 31,49 38,99211Fuente: Datos EUKLEMS (2009) y Cuadrado y González (2009). <strong>El</strong>aboración propia.
- Page 3 and 4:
El futuro de la economía española
- Page 9:
PRESENTACIÓNJerónimo Molina Herre
- Page 13 and 14:
INTRODUCCIÓN:SOBRE LA EVOLUCIÓN F
- Page 15 and 16:
INTRODUCCIÓN: SOBRE LA EVOLUCIÓN
- Page 17 and 18:
INTRODUCCIÓN: SOBRE LA EVOLUCIÓN
- Page 20 and 21:
EL FUTURO DE LA ECONOMÍA ESPAÑOLA
- Page 22 and 23:
EL FUTURO DE LA ECONOMÍA ESPAÑOLA
- Page 24 and 25:
EL FUTURO DE LA ECONOMÍA ESPAÑOLA
- Page 26 and 27:
EL FUTURO DE LA ECONOMÍA ESPAÑOLA
- Page 28 and 29:
EL FUTURO DE LA ECONOMÍA ESPAÑOLA
- Page 30 and 31:
EL FUTURO DE LA ECONOMÍA ESPAÑOLA
- Page 32 and 33:
EL FUTURO DE LA ECONOMÍA ESPAÑOLA
- Page 34 and 35:
EL FUTURO DE LA ECONOMÍA ESPAÑOLA
- Page 36 and 37:
EL FUTURO DE LA ECONOMÍA ESPAÑOLA
- Page 38 and 39:
EL FUTURO DE LA ECONOMÍA ESPAÑOLA
- Page 40:
EL FUTURO DE LA ECONOMÍA ESPAÑOLA
- Page 48 and 49:
EL FUTURO DE LA ECONOMÍA ESPAÑOLA
- Page 50 and 51:
EL FUTURO DE LA ECONOMÍA ESPAÑOLA
- Page 52 and 53:
EL FUTURO DE LA ECONOMÍA ESPAÑOLA
- Page 54 and 55:
EL FUTURO DE LA ECONOMÍA ESPAÑOLA
- Page 56 and 57:
EL FUTURO DE LA ECONOMÍA ESPAÑOLA
- Page 58 and 59:
EL FUTURO DE LA ECONOMÍA ESPAÑOLA
- Page 60 and 61:
EL FUTURO DE LA ECONOMÍA ESPAÑOLA
- Page 62 and 63:
EL FUTURO DE LA ECONOMÍA ESPAÑOLA
- Page 64 and 65:
EL FUTURO DE LA ECONOMÍA ESPAÑOLA
- Page 66 and 67:
EL FUTURO DE LA ECONOMÍA ESPAÑOLA
- Page 68 and 69:
EL FUTURO DE LA ECONOMÍA ESPAÑOLA
- Page 70 and 71:
EL FUTURO DE LA ECONOMÍA ESPAÑOLA
- Page 72 and 73:
EL FUTURO DE LA ECONOMÍA ESPAÑOLA
- Page 74 and 75:
EL FUTURO DE LA ECONOMÍA ESPAÑOLA
- Page 76 and 77:
EL FUTURO DE LA ECONOMÍA ESPAÑOLA
- Page 78 and 79:
EL FUTURO DE LA ECONOMÍA ESPAÑOLA
- Page 80 and 81:
EL FUTURO DE LA ECONOMÍA ESPAÑOLA
- Page 82 and 83:
EL FUTURO DE LA ECONOMÍA ESPAÑOLA
- Page 85 and 86:
EL FUTURO CIENTÍFICO DE LA ENERGÍ
- Page 87 and 88:
EL FUTURO CIENTÍFICO DE LA ENERGÍ
- Page 89 and 90:
EL FUTURO CIENTÍFICO DE LA ENERGÍ
- Page 91 and 92:
EL FUTURO CIENTÍFICO DE LA ENERGÍ
- Page 93 and 94:
EL FUTURO CIENTÍFICO DE LA ENERGÍ
- Page 95 and 96:
EL FUTURO CIENTÍFICO DE LA ENERGÍ
- Page 97 and 98:
EL FUTURO CIENTÍFICO DE LA ENERGÍ
- Page 99 and 100:
EL FUTURO CIENTÍFICO DE LA ENERGÍ
- Page 101 and 102:
EL FUTURO CIENTÍFICO DE LA ENERGÍ
- Page 103 and 104:
EL FUTURO CIENTÍFICO DE LA ENERGÍ
- Page 105 and 106:
EL FUTURO CIENTÍFICO DE LA ENERGÍ
- Page 107:
EL FUTURO CIENTÍFICO DE LA ENERGÍ
- Page 113 and 114:
EL PASADO ENERGÉTICO ESPAÑOL COMO
- Page 115 and 116:
EL PASADO ENERGÉTICO ESPAÑOL COMO
- Page 117 and 118:
EL PASADO ENERGÉTICO ESPAÑOL COMO
- Page 119 and 120:
EL PASADO ENERGÉTICO ESPAÑOL COMO
- Page 121 and 122:
EL PASADO ENERGÉTICO ESPAÑOL COMO
- Page 123 and 124:
EL PASADO ENERGÉTICO ESPAÑOL COMO
- Page 125 and 126:
EL PASADO ENERGÉTICO ESPAÑOL COMO
- Page 127:
EL PASADO ENERGÉTICO ESPAÑOL COMO
- Page 130 and 131:
EL FUTURO DE LA ECONOMÍA ESPAÑOLA
- Page 132 and 133:
EL FUTURO DE LA ECONOMÍA ESPAÑOLA
- Page 134 and 135:
EL FUTURO DE LA ECONOMÍA ESPAÑOLA
- Page 136 and 137:
EL FUTURO DE LA ECONOMÍA ESPAÑOLA
- Page 138 and 139:
EL FUTURO DE LA ECONOMÍA ESPAÑOLA
- Page 140 and 141:
EL FUTURO DE LA ECONOMÍA ESPAÑOLA
- Page 142 and 143:
EL FUTURO DE LA ECONOMÍA ESPAÑOLA
- Page 144:
EL FUTURO DE LA ECONOMÍA ESPAÑOLA
- Page 149 and 150:
UN ENSAYO DE PROSPECTIVA: LA INDUST
- Page 151 and 152:
UN ENSAYO DE PROSPECTIVA: LA INDUST
- Page 153:
UN ENSAYO DE PROSPECTIVA: LA INDUST
- Page 156 and 157:
EL FUTURO DE LA ECONOMÍA ESPAÑOLA
- Page 158 and 159:
EL FUTURO DE LA ECONOMÍA ESPAÑOLA
- Page 160 and 161: EL FUTURO DE LA ECONOMÍA ESPAÑOLA
- Page 162 and 163: EL FUTURO DE LA ECONOMÍA ESPAÑOLA
- Page 164 and 165: EL FUTURO DE LA ECONOMÍA ESPAÑOLA
- Page 166 and 167: EL FUTURO DE LA ECONOMÍA ESPAÑOLA
- Page 168 and 169: EL FUTURO DE LA ECONOMÍA ESPAÑOLA
- Page 170 and 171: EL FUTURO DE LA ECONOMÍA ESPAÑOLA
- Page 172 and 173: EL FUTURO DE LA ECONOMÍA ESPAÑOLA
- Page 174 and 175: EL FUTURO DE LA ECONOMÍA ESPAÑOLA
- Page 176 and 177: EL FUTURO DE LA ECONOMÍA ESPAÑOLA
- Page 178 and 179: EL FUTURO DE LA ECONOMÍA ESPAÑOLA
- Page 180 and 181: EL FUTURO DE LA ECONOMÍA ESPAÑOLA
- Page 182 and 183: EL FUTURO DE LA ECONOMÍA ESPAÑOLA
- Page 184 and 185: EL FUTURO DE LA ECONOMÍA ESPAÑOLA
- Page 186 and 187: EL FUTURO DE LA ECONOMÍA ESPAÑOLA
- Page 188 and 189: EL FUTURO DE LA ECONOMÍA ESPAÑOLA
- Page 190 and 191: EL FUTURO DE LA ECONOMÍA ESPAÑOLA
- Page 192 and 193: EL FUTURO DE LA ECONOMÍA ESPAÑOLA
- Page 194 and 195: EL FUTURO DE LA ECONOMÍA ESPAÑOLA
- Page 196 and 197: EL FUTURO DE LA ECONOMÍA ESPAÑOLA
- Page 198 and 199: EL FUTURO DE LA ECONOMÍA ESPAÑOLA
- Page 200 and 201: EL FUTURO DE LA ECONOMÍA ESPAÑOLA
- Page 202 and 203: EL FUTURO DE LA ECONOMÍA ESPAÑOLA
- Page 204 and 205: EL FUTURO DE LA ECONOMÍA ESPAÑOLA
- Page 206 and 207: EL FUTURO DE LA ECONOMÍA ESPAÑOLA
- Page 208 and 209: EL FUTURO DE LA ECONOMÍA ESPAÑOLA
- Page 212 and 213: EL FUTURO DE LA ECONOMÍA ESPAÑOLA
- Page 214 and 215: EL FUTURO DE LA ECONOMÍA ESPAÑOLA
- Page 216 and 217: EL FUTURO DE LA ECONOMÍA ESPAÑOLA
- Page 218 and 219: EL FUTURO DE LA ECONOMÍA ESPAÑOLA
- Page 220 and 221: EL FUTURO DE LA ECONOMÍA ESPAÑOLA
- Page 222 and 223: EL FUTURO DE LA ECONOMÍA ESPAÑOLA
- Page 224 and 225: EL FUTURO DE LA ECONOMÍA ESPAÑOLA
- Page 227 and 228: EL TURISMO: GLOBALIZACIÓN, COMPETI
- Page 229 and 230: EL TURISMO: GLOBALIZACIÓN, COMPETI
- Page 231 and 232: EL TURISMO: GLOBALIZACIÓN, COMPETI
- Page 233 and 234: EL TURISMO: GLOBALIZACIÓN, COMPETI
- Page 235 and 236: EL TURISMO: GLOBALIZACIÓN, COMPETI
- Page 237 and 238: EL TURISMO: GLOBALIZACIÓN, COMPETI
- Page 239 and 240: EL TURISMO: GLOBALIZACIÓN, COMPETI
- Page 241 and 242: EL TURISMO: GLOBALIZACIÓN, COMPETI
- Page 243 and 244: EL TURISMO: GLOBALIZACIÓN, COMPETI
- Page 245 and 246: EL TURISMO: GLOBALIZACIÓN, COMPETI
- Page 247 and 248: EL TURISMO: GLOBALIZACIÓN, COMPETI
- Page 249 and 250: EL TURISMO: GLOBALIZACIÓN, COMPETI
- Page 251 and 252: EL TURISMO: GLOBALIZACIÓN, COMPETI
- Page 253 and 254: EL TURISMO: GLOBALIZACIÓN, COMPETI
- Page 255 and 256: EL TURISMO: GLOBALIZACIÓN, COMPETI
- Page 257 and 258: LA UNIÓN EUROPEA EN EL MEDITERRÁN
- Page 259 and 260: LA UNIÓN EUROPEA EN EL MEDITERRÁN
- Page 261 and 262:
LA UNIÓN EUROPEA EN EL MEDITERRÁN
- Page 263 and 264:
LA UNIÓN EUROPEA EN EL MEDITERRÁN
- Page 265 and 266:
LA UNIÓN EUROPEA EN EL MEDITERRÁN
- Page 267 and 268:
LA UNIÓN EUROPEA EN EL MEDITERRÁN
- Page 269 and 270:
EL FUTURO DE IBEROAMÉRICARafael Pa
- Page 271 and 272:
EL FUTURO DE IBEROAMÉRICA /RAFAEL
- Page 273 and 274:
EL FUTURO DE IBEROAMÉRICA /RAFAEL
- Page 275 and 276:
EL FUTURO DE IBEROAMÉRICA /RAFAEL
- Page 277 and 278:
EL FUTURO DE IBEROAMÉRICA /RAFAEL
- Page 279 and 280:
EL FUTURO DE IBEROAMÉRICA /RAFAEL
- Page 281 and 282:
EL FUTURO DE IBEROAMÉRICA /RAFAEL
- Page 283 and 284:
EL FUTURO DE IBEROAMÉRICA /RAFAEL
- Page 285:
EL FUTURO DE IBEROAMÉRICA /RAFAEL
- Page 288 and 289:
EL FUTURO DE LA ECONOMÍA ESPAÑOLA
- Page 290 and 291:
EL FUTURO DE LA ECONOMÍA ESPAÑOLA
- Page 292 and 293:
EL FUTURO DE LA ECONOMÍA ESPAÑOLA
- Page 294 and 295:
EL FUTURO DE LA ECONOMÍA ESPAÑOLA
- Page 296 and 297:
EL FUTURO DE LA ECONOMÍA ESPAÑOLA
- Page 298 and 299:
EL FUTURO DE LA ECONOMÍA ESPAÑOLA
- Page 300 and 301:
EL FUTURO DE LA ECONOMÍA ESPAÑOLA
- Page 302 and 303:
EL FUTURO DE LA ECONOMÍA ESPAÑOLA
- Page 304 and 305:
EL FUTURO DE LA ECONOMÍA ESPAÑOLA
- Page 307 and 308:
EL FUTURO DEL SECTOR EXTERIOR DE ES
- Page 309 and 310:
EL FUTURO DEL SECTOR EXTERIOR DE ES
- Page 311 and 312:
EL FUTURO DEL SECTOR EXTERIOR DE ES
- Page 313 and 314:
EL FUTURO DEL SECTOR EXTERIOR DE ES
- Page 315 and 316:
EL FUTURO DEL SECTOR EXTERIOR DE ES
- Page 317 and 318:
EL FUTURO DEL SECTOR EXTERIOR DE ES
- Page 319 and 320:
EL FUTURO DEL SECTOR EXTERIOR DE ES
- Page 321 and 322:
EL FUTURO DEL SECTOR EXTERIOR DE ES
- Page 323 and 324:
EL FUTURO DEL SECTOR EXTERIOR DE ES
- Page 325 and 326:
EL FUTURO DEL SECTOR EXTERIOR DE ES
- Page 327 and 328:
EL FUTURO DEL SECTOR EXTERIOR DE ES
- Page 329 and 330:
EL FUTURO DEL SECTOR EXTERIOR DE ES
- Page 331 and 332:
EL FUTURO DEL SECTOR PÚBLICOJosé
- Page 333 and 334:
EL FUTURO DEL SECTOR PÚBLICO / JOS
- Page 335 and 336:
EL FUTURO DEL SECTOR PÚBLICO / JOS
- Page 337 and 338:
EL FUTURO DEL SECTOR PÚBLICO / JOS
- Page 339 and 340:
EL FUTURO DEL SECTOR PÚBLICO / JOS
- Page 341 and 342:
EL FUTURO DEL SECTOR PÚBLICO / JOS
- Page 343:
EL FUTURO DEL SECTOR PÚBLICO / JOS
- Page 346 and 347:
EL FUTURO DE LA ECONOMÍA ESPAÑOLA
- Page 348 and 349:
EL FUTURO DE LA ECONOMÍA ESPAÑOLA
- Page 350 and 351:
EL FUTURO DE LA ECONOMÍA ESPAÑOLA
- Page 352 and 353:
EL FUTURO DE LA ECONOMÍA ESPAÑOLA
- Page 354 and 355:
EL FUTURO DE LA ECONOMÍA ESPAÑOLA
- Page 356 and 357:
EL FUTURO DE LA ECONOMÍA ESPAÑOLA
- Page 358 and 359:
EL FUTURO DE LA ECONOMÍA ESPAÑOLA
- Page 360 and 361:
EL FUTURO DE LA ECONOMÍA ESPAÑOLA
- Page 362 and 363:
EL FUTURO DE LA ECONOMÍA ESPAÑOLA
- Page 364 and 365:
EL FUTURO DE LA ECONOMÍA ESPAÑOLA
- Page 366 and 367:
EL FUTURO DE LA ECONOMÍA ESPAÑOLA
- Page 368 and 369:
EL FUTURO DE LA ECONOMÍA ESPAÑOLA
- Page 370 and 371:
EL FUTURO DE LA ECONOMÍA ESPAÑOLA
- Page 372 and 373:
EL FUTURO DE LA ECONOMÍA ESPAÑOLA
- Page 374 and 375:
EL FUTURO DE LA ECONOMÍA ESPAÑOLA
- Page 376 and 377:
EL FUTURO DE LA ECONOMÍA ESPAÑOLA
- Page 378 and 379:
EL FUTURO DE LA ECONOMÍA ESPAÑOLA
- Page 380 and 381:
EL FUTURO DE LA ECONOMÍA ESPAÑOLA
- Page 382 and 383:
EL FUTURO DE LA ECONOMÍA ESPAÑOLA
- Page 384 and 385:
EL FUTURO DE LA ECONOMÍA ESPAÑOLA
- Page 386 and 387:
EL FUTURO DE LA ECONOMÍA ESPAÑOLA
- Page 388 and 389:
EL FUTURO DE LA ECONOMÍA ESPAÑOLA
- Page 390 and 391:
EL FUTURO DE LA ECONOMÍA ESPAÑOLA
- Page 392 and 393:
EL FUTURO DE LA ECONOMÍA ESPAÑOLA
- Page 394 and 395:
EL FUTURO DE LA ECONOMÍA ESPAÑOLA
- Page 396 and 397:
EL FUTURO DE LA ECONOMÍA ESPAÑOLA
- Page 398 and 399:
EL FUTURO DE LA ECONOMÍA ESPAÑOLA
- Page 400 and 401:
EL FUTURO DE LA ECONOMÍA ESPAÑOLA
- Page 402 and 403:
EL FUTURO DE LA ECONOMÍA ESPAÑOLA
- Page 404 and 405:
EL FUTURO DE LA ECONOMÍA ESPAÑOLA
- Page 406 and 407:
EL FUTURO DE LA ECONOMÍA ESPAÑOLA
- Page 408 and 409:
EL FUTURO DE LA ECONOMÍA ESPAÑOLA
- Page 410 and 411:
EL FUTURO DE LA ECONOMÍA ESPAÑOLA
- Page 412 and 413:
EL FUTURO DE LA ECONOMÍA ESPAÑOLA
- Page 414 and 415:
EL FUTURO DE LA ECONOMÍA ESPAÑOLA
- Page 417 and 418:
LA EMPRESA DEL FUTUROÁlvaro Cuervo
- Page 419 and 420:
LA EMPRESA DEL FUTURO / ÁLVARO CUE
- Page 421 and 422:
LA EMPRESA DEL FUTURO / ÁLVARO CUE
- Page 423 and 424:
LA EMPRESA DEL FUTURO / ÁLVARO CUE
- Page 425 and 426:
LA EMPRESA DEL FUTURO / ÁLVARO CUE
- Page 427 and 428:
LA EMPRESA DEL FUTURO / ÁLVARO CUE
- Page 429 and 430:
LA EMPRESA DEL FUTURO / ÁLVARO CUE
- Page 431 and 432:
LA EMPRESA DEL FUTURO / ÁLVARO CUE
- Page 433 and 434:
LA EMPRESA DEL FUTURO / ÁLVARO CUE
- Page 435 and 436:
LA MEJORA DE LA PRODUCTIVIDAD EN LA
- Page 437 and 438:
LA MEJORA DE LA PRODUCTIVIDAD EN LA
- Page 439 and 440:
LA MEJORA DE LA PRODUCTIVIDAD EN LA
- Page 441 and 442:
LA MEJORA DE LA PRODUCTIVIDAD EN LA
- Page 443 and 444:
LA MEJORA DE LA PRODUCTIVIDAD EN LA
- Page 445 and 446:
LA MEJORA DE LA PRODUCTIVIDAD EN LA
- Page 447 and 448:
LA MEJORA DE LA PRODUCTIVIDAD EN LA
- Page 449 and 450:
LA MEJORA DE LA PRODUCTIVIDAD EN LA
- Page 451 and 452:
LA MEJORA DE LA PRODUCTIVIDAD EN LA
- Page 453 and 454:
LA MEJORA DE LA PRODUCTIVIDAD EN LA
- Page 455:
LA MEJORA DE LA PRODUCTIVIDAD EN LA