EL FUTURO DE LA ECONOMÍA ESPAÑOLATab<strong>la</strong> 5. Dinamismo <strong>de</strong> <strong>la</strong>s exportaciones por países en 2007*Sectores Porcentaje s/total Rep. 1 TVA 2Total 100,0 6,8 6,8Intra-UE 70,1 3,9 5,5Extra-UE 29,9 2,9 10,0Principales <strong>de</strong>stinos <strong>de</strong> <strong>la</strong> exportación españo<strong>la</strong>Francia 18,6 1,2 6,4Alemania 10,8 0,6 5,8Portugal 8,6 0,4 4,6Italia 8,5 0,5 6,2Reino Unido 7,5 0,2 2,0Estados Unidos 4,2 0,0 0,9* Datos provisionales.1Rep.: repercusión, contribución <strong>de</strong>l sector al aumento/<strong>de</strong>scenso interanual <strong>de</strong>l total <strong>de</strong>l ejercicio.2TVA: tasa <strong>de</strong> variación interanual (en porcentaje).Fuente: S. G. <strong>de</strong> Análisis, Estrategia y Evaluación con datos <strong>de</strong> Aduanas.Tab<strong>la</strong> 6. Dinamismo <strong>de</strong> <strong>la</strong>s importaciones por sectores en 2007*Sectores Porcentaje s/total Rep. 1 TVA 2Total 100,0 6,8 6,8Intra-UE 70,1 3,9 5,5Extra-UE 29,9 2,9 10,0Principales proveedores españoles314Alemania 18,6 1,2 6,4Francia 10,8 0,6 5,8Italia 8,6 0,4 4,6China 8,5 0,5 6,2Reino Unido 7,5 0,2 2,0Países Bajos 4,2 0,0 0,9* Datos provisionales.1Rep.: repercusión, contribución <strong>de</strong>l sector al aumento/<strong>de</strong>scenso interanual <strong>de</strong>l total <strong>de</strong>l ejercicio.2TVA: tasa <strong>de</strong> variación interanual (en porcentaje).Fuente: S. G. <strong>de</strong> Análisis, Estrategia y Evaluación con datos <strong>de</strong> Aduanas.
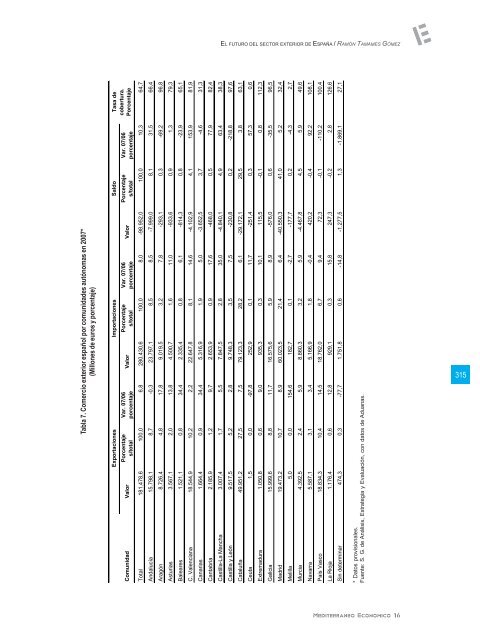
EL FUTURO DEL SECTOR EXTERIOR DE ESPAÑA / RAMÓN TAMAMES GÓMEZTab<strong>la</strong> 7. Comercio exterior español por comunida<strong>de</strong>s autónomas en 2007*(Millones <strong>de</strong> euros y porcentaje)Exportaciones Importaciones Saldo Tasa <strong>de</strong>cobertura.PorcentajeVar. 07/06porcentajePorcentajes/totalValorVar. 07/06porcentajePorcentajes/totalValorVar. 07/06porcentajePorcentajes/totalComunidad ValorTotal 181.478,6 100,0 6,8 280.430,6 100,0 8,0 -98.952,0 100,0 10,3 64,7Andalucía 15.798,1 8,7 -0,3 23.797,1 8,5 8,5 -7.999,0 8,1 31,5 66,4Aragón 8.726,4 4,8 17,8 9.019,5 3,2 7,8 -293,1 0,3 -69,2 96,8Asturias 3.567,1 2,0 13,8 4.500,7 1,6 11,0 -933,6 0,9 1,3 79,3Baleares 1.521,1 0,8 34,4 2.335,4 0,8 6,1 -814,3 0,8 -23,9 65,1C. Valenciana 18.544,9 10,2 2,2 22.647,8 8,1 14,6 -4.102,9 4,1 153,9 81,9Canarias 1.664,4 0,9 34,4 5.316,9 1,9 5,0 -3.652,5 3,7 -4,6 31,3Cantabria 2.185,9 1,2 9,7 2.653,9 0,9 17,6 -468,0 0,5 77,9 82,4Castil<strong>la</strong>-La Mancha 3.007,4 1,7 5,5 7.847,5 2,8 35,0 -4.840,1 4,9 63,4 38,3Castil<strong>la</strong> y León 9.517,5 5,2 2,8 9.748,3 3,5 7,5 -230,8 0,2 -218,8 97,6Cataluña 49.951,2 27,5 7,5 79.123,3 28,2 6,1 -29.172,1 29,5 3,8 63,1Ceuta 1,5 0,0 -97,8 252,9 0,1 11,7 -251,4 0,3 57,3 0,6Extremadura 1.050,8 0,6 9,0 935,3 0,3 10,1 115,5 -0,1 0,8 112,3Galicia 15.999,6 8,8 11,7 16.575,6 5,9 8,9 -576,0 0,6 -35,5 96,5Madrid 19.473,2 10,7 8,9 60.023,5 21,4 6,4 -40.550,3 41,0 5,2 32,4Melil<strong>la</strong> 5,0 0,0 154,6 182,7 0,1 -2,7 -177,7 0,2 -4,3 2,7Murcia 4.392,5 2,4 5,9 8.860,3 3,2 5,9 -4.467,8 4,5 5,9 49,6Navarra 5.587,1 3,1 3,4 5.166,9 1,8 -0,4 420,2 -0,4 92,2 108,1País Vasco 18.834,3 10,4 14,5 18.762,0 6,7 9,4 72,3 -0,1 -110,2 100,4La Rioja 1.176,4 0,6 12,8 929,1 0,3 15,8 247,3 -0,2 2,8 126,6Sin <strong>de</strong>terminar 474,3 0,3 -77,7 1.751,8 0,6 -14,8 -1.277,5 1,3 -1.869,1 27,1* Datos provisionales.Fuente: S. G. <strong>de</strong> Análisis, Estrategia y Evaluación, con datos <strong>de</strong> Aduanas.315
- Page 3 and 4:
El futuro de la economía española
- Page 9:
PRESENTACIÓNJerónimo Molina Herre
- Page 13 and 14:
INTRODUCCIÓN:SOBRE LA EVOLUCIÓN F
- Page 15 and 16:
INTRODUCCIÓN: SOBRE LA EVOLUCIÓN
- Page 17 and 18:
INTRODUCCIÓN: SOBRE LA EVOLUCIÓN
- Page 20 and 21:
EL FUTURO DE LA ECONOMÍA ESPAÑOLA
- Page 22 and 23:
EL FUTURO DE LA ECONOMÍA ESPAÑOLA
- Page 24 and 25:
EL FUTURO DE LA ECONOMÍA ESPAÑOLA
- Page 26 and 27:
EL FUTURO DE LA ECONOMÍA ESPAÑOLA
- Page 28 and 29:
EL FUTURO DE LA ECONOMÍA ESPAÑOLA
- Page 30 and 31:
EL FUTURO DE LA ECONOMÍA ESPAÑOLA
- Page 32 and 33:
EL FUTURO DE LA ECONOMÍA ESPAÑOLA
- Page 34 and 35:
EL FUTURO DE LA ECONOMÍA ESPAÑOLA
- Page 36 and 37:
EL FUTURO DE LA ECONOMÍA ESPAÑOLA
- Page 38 and 39:
EL FUTURO DE LA ECONOMÍA ESPAÑOLA
- Page 40:
EL FUTURO DE LA ECONOMÍA ESPAÑOLA
- Page 48 and 49:
EL FUTURO DE LA ECONOMÍA ESPAÑOLA
- Page 50 and 51:
EL FUTURO DE LA ECONOMÍA ESPAÑOLA
- Page 52 and 53:
EL FUTURO DE LA ECONOMÍA ESPAÑOLA
- Page 54 and 55:
EL FUTURO DE LA ECONOMÍA ESPAÑOLA
- Page 56 and 57:
EL FUTURO DE LA ECONOMÍA ESPAÑOLA
- Page 58 and 59:
EL FUTURO DE LA ECONOMÍA ESPAÑOLA
- Page 60 and 61:
EL FUTURO DE LA ECONOMÍA ESPAÑOLA
- Page 62 and 63:
EL FUTURO DE LA ECONOMÍA ESPAÑOLA
- Page 64 and 65:
EL FUTURO DE LA ECONOMÍA ESPAÑOLA
- Page 66 and 67:
EL FUTURO DE LA ECONOMÍA ESPAÑOLA
- Page 68 and 69:
EL FUTURO DE LA ECONOMÍA ESPAÑOLA
- Page 70 and 71:
EL FUTURO DE LA ECONOMÍA ESPAÑOLA
- Page 72 and 73:
EL FUTURO DE LA ECONOMÍA ESPAÑOLA
- Page 74 and 75:
EL FUTURO DE LA ECONOMÍA ESPAÑOLA
- Page 76 and 77:
EL FUTURO DE LA ECONOMÍA ESPAÑOLA
- Page 78 and 79:
EL FUTURO DE LA ECONOMÍA ESPAÑOLA
- Page 80 and 81:
EL FUTURO DE LA ECONOMÍA ESPAÑOLA
- Page 82 and 83:
EL FUTURO DE LA ECONOMÍA ESPAÑOLA
- Page 85 and 86:
EL FUTURO CIENTÍFICO DE LA ENERGÍ
- Page 87 and 88:
EL FUTURO CIENTÍFICO DE LA ENERGÍ
- Page 89 and 90:
EL FUTURO CIENTÍFICO DE LA ENERGÍ
- Page 91 and 92:
EL FUTURO CIENTÍFICO DE LA ENERGÍ
- Page 93 and 94:
EL FUTURO CIENTÍFICO DE LA ENERGÍ
- Page 95 and 96:
EL FUTURO CIENTÍFICO DE LA ENERGÍ
- Page 97 and 98:
EL FUTURO CIENTÍFICO DE LA ENERGÍ
- Page 99 and 100:
EL FUTURO CIENTÍFICO DE LA ENERGÍ
- Page 101 and 102:
EL FUTURO CIENTÍFICO DE LA ENERGÍ
- Page 103 and 104:
EL FUTURO CIENTÍFICO DE LA ENERGÍ
- Page 105 and 106:
EL FUTURO CIENTÍFICO DE LA ENERGÍ
- Page 107:
EL FUTURO CIENTÍFICO DE LA ENERGÍ
- Page 113 and 114:
EL PASADO ENERGÉTICO ESPAÑOL COMO
- Page 115 and 116:
EL PASADO ENERGÉTICO ESPAÑOL COMO
- Page 117 and 118:
EL PASADO ENERGÉTICO ESPAÑOL COMO
- Page 119 and 120:
EL PASADO ENERGÉTICO ESPAÑOL COMO
- Page 121 and 122:
EL PASADO ENERGÉTICO ESPAÑOL COMO
- Page 123 and 124:
EL PASADO ENERGÉTICO ESPAÑOL COMO
- Page 125 and 126:
EL PASADO ENERGÉTICO ESPAÑOL COMO
- Page 127:
EL PASADO ENERGÉTICO ESPAÑOL COMO
- Page 130 and 131:
EL FUTURO DE LA ECONOMÍA ESPAÑOLA
- Page 132 and 133:
EL FUTURO DE LA ECONOMÍA ESPAÑOLA
- Page 134 and 135:
EL FUTURO DE LA ECONOMÍA ESPAÑOLA
- Page 136 and 137:
EL FUTURO DE LA ECONOMÍA ESPAÑOLA
- Page 138 and 139:
EL FUTURO DE LA ECONOMÍA ESPAÑOLA
- Page 140 and 141:
EL FUTURO DE LA ECONOMÍA ESPAÑOLA
- Page 142 and 143:
EL FUTURO DE LA ECONOMÍA ESPAÑOLA
- Page 144:
EL FUTURO DE LA ECONOMÍA ESPAÑOLA
- Page 149 and 150:
UN ENSAYO DE PROSPECTIVA: LA INDUST
- Page 151 and 152:
UN ENSAYO DE PROSPECTIVA: LA INDUST
- Page 153:
UN ENSAYO DE PROSPECTIVA: LA INDUST
- Page 156 and 157:
EL FUTURO DE LA ECONOMÍA ESPAÑOLA
- Page 158 and 159:
EL FUTURO DE LA ECONOMÍA ESPAÑOLA
- Page 160 and 161:
EL FUTURO DE LA ECONOMÍA ESPAÑOLA
- Page 162 and 163:
EL FUTURO DE LA ECONOMÍA ESPAÑOLA
- Page 164 and 165:
EL FUTURO DE LA ECONOMÍA ESPAÑOLA
- Page 166 and 167:
EL FUTURO DE LA ECONOMÍA ESPAÑOLA
- Page 168 and 169:
EL FUTURO DE LA ECONOMÍA ESPAÑOLA
- Page 170 and 171:
EL FUTURO DE LA ECONOMÍA ESPAÑOLA
- Page 172 and 173:
EL FUTURO DE LA ECONOMÍA ESPAÑOLA
- Page 174 and 175:
EL FUTURO DE LA ECONOMÍA ESPAÑOLA
- Page 176 and 177:
EL FUTURO DE LA ECONOMÍA ESPAÑOLA
- Page 178 and 179:
EL FUTURO DE LA ECONOMÍA ESPAÑOLA
- Page 180 and 181:
EL FUTURO DE LA ECONOMÍA ESPAÑOLA
- Page 182 and 183:
EL FUTURO DE LA ECONOMÍA ESPAÑOLA
- Page 184 and 185:
EL FUTURO DE LA ECONOMÍA ESPAÑOLA
- Page 186 and 187:
EL FUTURO DE LA ECONOMÍA ESPAÑOLA
- Page 188 and 189:
EL FUTURO DE LA ECONOMÍA ESPAÑOLA
- Page 190 and 191:
EL FUTURO DE LA ECONOMÍA ESPAÑOLA
- Page 192 and 193:
EL FUTURO DE LA ECONOMÍA ESPAÑOLA
- Page 194 and 195:
EL FUTURO DE LA ECONOMÍA ESPAÑOLA
- Page 196 and 197:
EL FUTURO DE LA ECONOMÍA ESPAÑOLA
- Page 198 and 199:
EL FUTURO DE LA ECONOMÍA ESPAÑOLA
- Page 200 and 201:
EL FUTURO DE LA ECONOMÍA ESPAÑOLA
- Page 202 and 203:
EL FUTURO DE LA ECONOMÍA ESPAÑOLA
- Page 204 and 205:
EL FUTURO DE LA ECONOMÍA ESPAÑOLA
- Page 206 and 207:
EL FUTURO DE LA ECONOMÍA ESPAÑOLA
- Page 208 and 209:
EL FUTURO DE LA ECONOMÍA ESPAÑOLA
- Page 210 and 211:
EL FUTURO DE LA ECONOMÍA ESPAÑOLA
- Page 212 and 213:
EL FUTURO DE LA ECONOMÍA ESPAÑOLA
- Page 214 and 215:
EL FUTURO DE LA ECONOMÍA ESPAÑOLA
- Page 216 and 217:
EL FUTURO DE LA ECONOMÍA ESPAÑOLA
- Page 218 and 219:
EL FUTURO DE LA ECONOMÍA ESPAÑOLA
- Page 220 and 221:
EL FUTURO DE LA ECONOMÍA ESPAÑOLA
- Page 222 and 223:
EL FUTURO DE LA ECONOMÍA ESPAÑOLA
- Page 224 and 225:
EL FUTURO DE LA ECONOMÍA ESPAÑOLA
- Page 227 and 228:
EL TURISMO: GLOBALIZACIÓN, COMPETI
- Page 229 and 230:
EL TURISMO: GLOBALIZACIÓN, COMPETI
- Page 231 and 232:
EL TURISMO: GLOBALIZACIÓN, COMPETI
- Page 233 and 234:
EL TURISMO: GLOBALIZACIÓN, COMPETI
- Page 235 and 236:
EL TURISMO: GLOBALIZACIÓN, COMPETI
- Page 237 and 238:
EL TURISMO: GLOBALIZACIÓN, COMPETI
- Page 239 and 240:
EL TURISMO: GLOBALIZACIÓN, COMPETI
- Page 241 and 242:
EL TURISMO: GLOBALIZACIÓN, COMPETI
- Page 243 and 244:
EL TURISMO: GLOBALIZACIÓN, COMPETI
- Page 245 and 246:
EL TURISMO: GLOBALIZACIÓN, COMPETI
- Page 247 and 248:
EL TURISMO: GLOBALIZACIÓN, COMPETI
- Page 249 and 250:
EL TURISMO: GLOBALIZACIÓN, COMPETI
- Page 251 and 252:
EL TURISMO: GLOBALIZACIÓN, COMPETI
- Page 253 and 254:
EL TURISMO: GLOBALIZACIÓN, COMPETI
- Page 255 and 256:
EL TURISMO: GLOBALIZACIÓN, COMPETI
- Page 257 and 258:
LA UNIÓN EUROPEA EN EL MEDITERRÁN
- Page 259 and 260:
LA UNIÓN EUROPEA EN EL MEDITERRÁN
- Page 261 and 262:
LA UNIÓN EUROPEA EN EL MEDITERRÁN
- Page 263 and 264: LA UNIÓN EUROPEA EN EL MEDITERRÁN
- Page 265 and 266: LA UNIÓN EUROPEA EN EL MEDITERRÁN
- Page 267 and 268: LA UNIÓN EUROPEA EN EL MEDITERRÁN
- Page 269 and 270: EL FUTURO DE IBEROAMÉRICARafael Pa
- Page 271 and 272: EL FUTURO DE IBEROAMÉRICA /RAFAEL
- Page 273 and 274: EL FUTURO DE IBEROAMÉRICA /RAFAEL
- Page 275 and 276: EL FUTURO DE IBEROAMÉRICA /RAFAEL
- Page 277 and 278: EL FUTURO DE IBEROAMÉRICA /RAFAEL
- Page 279 and 280: EL FUTURO DE IBEROAMÉRICA /RAFAEL
- Page 281 and 282: EL FUTURO DE IBEROAMÉRICA /RAFAEL
- Page 283 and 284: EL FUTURO DE IBEROAMÉRICA /RAFAEL
- Page 285: EL FUTURO DE IBEROAMÉRICA /RAFAEL
- Page 288 and 289: EL FUTURO DE LA ECONOMÍA ESPAÑOLA
- Page 290 and 291: EL FUTURO DE LA ECONOMÍA ESPAÑOLA
- Page 292 and 293: EL FUTURO DE LA ECONOMÍA ESPAÑOLA
- Page 294 and 295: EL FUTURO DE LA ECONOMÍA ESPAÑOLA
- Page 296 and 297: EL FUTURO DE LA ECONOMÍA ESPAÑOLA
- Page 298 and 299: EL FUTURO DE LA ECONOMÍA ESPAÑOLA
- Page 300 and 301: EL FUTURO DE LA ECONOMÍA ESPAÑOLA
- Page 302 and 303: EL FUTURO DE LA ECONOMÍA ESPAÑOLA
- Page 304 and 305: EL FUTURO DE LA ECONOMÍA ESPAÑOLA
- Page 307 and 308: EL FUTURO DEL SECTOR EXTERIOR DE ES
- Page 309 and 310: EL FUTURO DEL SECTOR EXTERIOR DE ES
- Page 311 and 312: EL FUTURO DEL SECTOR EXTERIOR DE ES
- Page 313: EL FUTURO DEL SECTOR EXTERIOR DE ES
- Page 317 and 318: EL FUTURO DEL SECTOR EXTERIOR DE ES
- Page 319 and 320: EL FUTURO DEL SECTOR EXTERIOR DE ES
- Page 321 and 322: EL FUTURO DEL SECTOR EXTERIOR DE ES
- Page 323 and 324: EL FUTURO DEL SECTOR EXTERIOR DE ES
- Page 325 and 326: EL FUTURO DEL SECTOR EXTERIOR DE ES
- Page 327 and 328: EL FUTURO DEL SECTOR EXTERIOR DE ES
- Page 329 and 330: EL FUTURO DEL SECTOR EXTERIOR DE ES
- Page 331 and 332: EL FUTURO DEL SECTOR PÚBLICOJosé
- Page 333 and 334: EL FUTURO DEL SECTOR PÚBLICO / JOS
- Page 335 and 336: EL FUTURO DEL SECTOR PÚBLICO / JOS
- Page 337 and 338: EL FUTURO DEL SECTOR PÚBLICO / JOS
- Page 339 and 340: EL FUTURO DEL SECTOR PÚBLICO / JOS
- Page 341 and 342: EL FUTURO DEL SECTOR PÚBLICO / JOS
- Page 343: EL FUTURO DEL SECTOR PÚBLICO / JOS
- Page 346 and 347: EL FUTURO DE LA ECONOMÍA ESPAÑOLA
- Page 348 and 349: EL FUTURO DE LA ECONOMÍA ESPAÑOLA
- Page 350 and 351: EL FUTURO DE LA ECONOMÍA ESPAÑOLA
- Page 352 and 353: EL FUTURO DE LA ECONOMÍA ESPAÑOLA
- Page 354 and 355: EL FUTURO DE LA ECONOMÍA ESPAÑOLA
- Page 356 and 357: EL FUTURO DE LA ECONOMÍA ESPAÑOLA
- Page 358 and 359: EL FUTURO DE LA ECONOMÍA ESPAÑOLA
- Page 360 and 361: EL FUTURO DE LA ECONOMÍA ESPAÑOLA
- Page 362 and 363: EL FUTURO DE LA ECONOMÍA ESPAÑOLA
- Page 364 and 365:
EL FUTURO DE LA ECONOMÍA ESPAÑOLA
- Page 366 and 367:
EL FUTURO DE LA ECONOMÍA ESPAÑOLA
- Page 368 and 369:
EL FUTURO DE LA ECONOMÍA ESPAÑOLA
- Page 370 and 371:
EL FUTURO DE LA ECONOMÍA ESPAÑOLA
- Page 372 and 373:
EL FUTURO DE LA ECONOMÍA ESPAÑOLA
- Page 374 and 375:
EL FUTURO DE LA ECONOMÍA ESPAÑOLA
- Page 376 and 377:
EL FUTURO DE LA ECONOMÍA ESPAÑOLA
- Page 378 and 379:
EL FUTURO DE LA ECONOMÍA ESPAÑOLA
- Page 380 and 381:
EL FUTURO DE LA ECONOMÍA ESPAÑOLA
- Page 382 and 383:
EL FUTURO DE LA ECONOMÍA ESPAÑOLA
- Page 384 and 385:
EL FUTURO DE LA ECONOMÍA ESPAÑOLA
- Page 386 and 387:
EL FUTURO DE LA ECONOMÍA ESPAÑOLA
- Page 388 and 389:
EL FUTURO DE LA ECONOMÍA ESPAÑOLA
- Page 390 and 391:
EL FUTURO DE LA ECONOMÍA ESPAÑOLA
- Page 392 and 393:
EL FUTURO DE LA ECONOMÍA ESPAÑOLA
- Page 394 and 395:
EL FUTURO DE LA ECONOMÍA ESPAÑOLA
- Page 396 and 397:
EL FUTURO DE LA ECONOMÍA ESPAÑOLA
- Page 398 and 399:
EL FUTURO DE LA ECONOMÍA ESPAÑOLA
- Page 400 and 401:
EL FUTURO DE LA ECONOMÍA ESPAÑOLA
- Page 402 and 403:
EL FUTURO DE LA ECONOMÍA ESPAÑOLA
- Page 404 and 405:
EL FUTURO DE LA ECONOMÍA ESPAÑOLA
- Page 406 and 407:
EL FUTURO DE LA ECONOMÍA ESPAÑOLA
- Page 408 and 409:
EL FUTURO DE LA ECONOMÍA ESPAÑOLA
- Page 410 and 411:
EL FUTURO DE LA ECONOMÍA ESPAÑOLA
- Page 412 and 413:
EL FUTURO DE LA ECONOMÍA ESPAÑOLA
- Page 414 and 415:
EL FUTURO DE LA ECONOMÍA ESPAÑOLA
- Page 417 and 418:
LA EMPRESA DEL FUTUROÁlvaro Cuervo
- Page 419 and 420:
LA EMPRESA DEL FUTURO / ÁLVARO CUE
- Page 421 and 422:
LA EMPRESA DEL FUTURO / ÁLVARO CUE
- Page 423 and 424:
LA EMPRESA DEL FUTURO / ÁLVARO CUE
- Page 425 and 426:
LA EMPRESA DEL FUTURO / ÁLVARO CUE
- Page 427 and 428:
LA EMPRESA DEL FUTURO / ÁLVARO CUE
- Page 429 and 430:
LA EMPRESA DEL FUTURO / ÁLVARO CUE
- Page 431 and 432:
LA EMPRESA DEL FUTURO / ÁLVARO CUE
- Page 433 and 434:
LA EMPRESA DEL FUTURO / ÁLVARO CUE
- Page 435 and 436:
LA MEJORA DE LA PRODUCTIVIDAD EN LA
- Page 437 and 438:
LA MEJORA DE LA PRODUCTIVIDAD EN LA
- Page 439 and 440:
LA MEJORA DE LA PRODUCTIVIDAD EN LA
- Page 441 and 442:
LA MEJORA DE LA PRODUCTIVIDAD EN LA
- Page 443 and 444:
LA MEJORA DE LA PRODUCTIVIDAD EN LA
- Page 445 and 446:
LA MEJORA DE LA PRODUCTIVIDAD EN LA
- Page 447 and 448:
LA MEJORA DE LA PRODUCTIVIDAD EN LA
- Page 449 and 450:
LA MEJORA DE LA PRODUCTIVIDAD EN LA
- Page 451 and 452:
LA MEJORA DE LA PRODUCTIVIDAD EN LA
- Page 453 and 454:
LA MEJORA DE LA PRODUCTIVIDAD EN LA
- Page 455:
LA MEJORA DE LA PRODUCTIVIDAD EN LA