TABLEAU V luhlr clu'mocldt· elu 1 ( li•1f dt! 1 r/,· .\1/u/,·nr l11hn J l>tlnnc ln 1;dnu' dl' l'{(alf 1 ayant la ploh;Jhilllt~ / ' d 'cr•c tkΕ;'' ' t~c; ,. 11omhrl' dl' th.:-1-!,l'' <strong>de</strong> hhc:rlt~ n " 0,'-JO 0,80 0,70 {),60 0,50 0,40 IUO 0,20 0 ,1 0 0,05 0,02 0.01 1 0.000 0 , 1 ~8 Il, 125 (),51 0 0,727 1 . 000 1' 17(, 1 ,Wl.l J ,07H 6,) 14 12 ,706 J 1,R21 6J,fl57 2 0,000 0,142 0 , 2!N 0,445 0,617 0, H 1 fl I.Ofll 1, ) Hf! I,HR6 2,'-;120 4,)01 h,%5 9,925 J 0,000 0, 1.17 0,277 0,424 0, 5R4 0, 7tl) O,IJ7H 1,250 1 ,tiJH 2,.15.1 3, 1 H2 4,541 5,H41 4 0,000 0,134 0,271 0,414 0,56') il. 741 0,941 1 ' 190 1,513 2,132 2, 77(, 3, 747 4,604 5 O,IXXJ 0,112 0,2()7 0,408 0, 559 0,727 0,920 1 .1 ~(, 1,47(, 2,015 2,571 J.Jh5 4,0.12 6 0.000 0. 111 0,256 0,404 0,55.1 0,71H O., 'XI(, 1,1 \4 1,440 1,94.1 2,447 .1, 14.1 3. 707 7 0,000 0.1 .10 Il. 2fl.l 0,402 0,549 0,711 0, H 1 1(> 1, 11'1 1,415 1,H95 2,.165 2.9'-JH 3,49'1 H O.IXJO 0.1 .10 0,2ti2 0,399 0,54tl o. 70(1 O,HH'I I, IOH 1,.197 I,H60 2,.10(, 2,HlJfl 3,)55 'J O,IKJO 0, 12'1 0,261 O,J9H 0,54.1 0, 70 .1 O,HH1 1, I!HJ l ,.lH.l 1,H31 2,2fl2 2.H21 :1,250 10 0,000 o. 12'1 0, 2(1() 0,397 0,542 0,7()() O,H7'1 1,0'1.1 1.n2 I,HI2 2,22H 2,7M J,Jfll) Il O,IXJO 0,121) 0,2()() 0,396 0,540 0,(-.97 O,H7h I.IIHH . 1 ..lfl.l 1,79f, 2,201 2,718 3,106 ~ 12 0,()()() 0.12H 0. 259 0,395 0,5.1'1 o . m~ O,H71 I,OHl ID l,.lSfl 1, 7H2 2. 179 IJ II,IHJO 2.M!I 3,055 0, 12H 0,2)9 cr 0,]94 O,S.lH 0,6'14 1),)00 1 ,07'1 1 ,.1)0 1,771 2, 1(,() 14 2,(150 O,IKKI 0, 12H 3.012 11.2~~ O,WJ 0 ,517 i 0,1.'12 0. HI>H 1,07(, 1 ' 14~ 1, 7fll 2 , 14~ 15 0,1)()() 2.h24 2,'177 0,12H 11,2SH O,WJ O,S1fl 0. h'll 0. H()(, 1,074 1,141 1, 751 lfl 2. 1.11 2,1i02 2,947 Il,()()() 0.12H 0,25H O,W2 0,51~ II.(>'XI O , H(,~ 1,071 un 1,746 2.120 2, ~Hl 17 0,0011 2,'121 0,12H 0,257 0,.192 o. ~~·1 II,(>H'I II ,H1>1 1,06'1 t,lB 1,740 2, 110 1 2,5h 7 2,H9H ~ 0,1)()() 0,127 0,2q 0,:192 0,51-1 ll,hHK II ,Hh:! 1,067 l .DII 1.7H 2, 101 ~ . 5~~ 1'1 0,()()(1 2,!0!! o. 12 7 0.2~7 O,.WI O.H1 II.I>KK O,HI>I 1,06(, U2H 1,72'1 2,11'11 2.~1'1 20 2,Hf>l (),()()() 0,127 0 . 2~7 O,WI 0,5.11 0,6H 7 11, Hhll I.OM 1 ,.125 1,725 2. OH(> 2J2H 2.845 21 0 , ()()() 0,127 0 ,25 7 0,391 O,B2 IIJ>Hh O.K~'I 1 , 06~ 1 .121 1 721 2,0HO 22 0,()()() nrH 0,127 2,!01 0,25{) o.wo 0,5.12 0 ,6Hf. O.H~H I,Oiil 1,121 1, 717 2,07-1 2J 2,50H (),()()() 0, 127 2,R 19 0,256 0,390 0,532 O,(>H'i II,H 'iH I,OiiO 1. J 19 1 ' 714 2 ,(l(,l) 24 2 . ~00 O,lXXJ 0, 127 2 .H07 0,256 0,390 0,5.11 O,liH5 0,!!57 1,05'1 I,J IR 1, 711 25 2.0M 2,492 0,()()() 0, 1 :!7 2. 7'17 0,251i 0,390 0,5.11 O,f.H4 II.H~h I . O~H 2{) 1 ,lili 1,70H 2. ()(,() O,!XXJ 2,4H5 0, 127 2. 71!7 0,251i 0,390 0.5.11 O,hH4 O . H~6 1,05H 1,315 1,706 27 2,1151· 2,479 0,000 0,127 2.779 0,256 0,389 0, 531 0,6H4 O,H55 1,057 1,314 1, 70.1 2.052 2,47_1 2R 0. 000 2, 771 0, 127 0,256 0,389 ().510 0,68.1 0,!!55 1,056 I,J 13 1,701 2,()41\ 29 O,()(JO 2,467 2, 763 0,127 0,256 0,389 0,510. O,llH.l O,H54 - 1,055 1,3 Il 1,699 2,()45 2,462 2,756 ~ .10 0,()()() 0,127 0, 251l O,.lR9 · O,BO 0,61! .1 O,H54 1,055 1,]10 1,697 2,042 2,457 2,750 ' $ • 0,111111 O.f?.f, 0,]\ 1 0, .1H\ o. \24 ll,lo7•1 Il, H·l.' 1 ,Ill(, UH2 I.M5 1. ,t:- •)(,1) ~.l2fl 2; 57(, ........ Jean <strong>de</strong> <strong>La</strong>gar<strong>de</strong>, Initiation à 1 'analyse <strong>de</strong>s données, Dunod, Paris 1983.
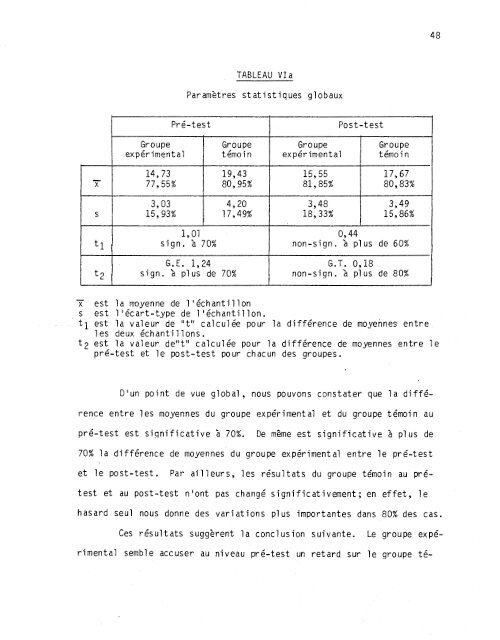
48 TABLEAU VIa Paramètres statistiques globaux Pré-test Post-test Groupe Groupe Groupe Groupe expérim<strong>en</strong>ta 1 témoin expérim<strong>en</strong>tal témoin 14,73 19,43 15,55 17,67 x 77' 55% 80,95% 81,85% 80,83% 3,03 4,20 3,48 3,49 s 15,93% 17,49% 18,33% 15,86% 1, 01 0,44 tl sign. à 70% non-sign. à pl us <strong>de</strong> 60% G. E. 1,24 G.T. 0,18 t2 sign. à plus <strong>de</strong> 70% non-sign. à pl us <strong>de</strong> 80% x est la moy<strong>en</strong>ne <strong>de</strong> l'échantillon s est 1 'écart-type <strong>de</strong> 1 'échantillon. t1 est la valeur <strong>de</strong> "t" calculée pour la différ<strong>en</strong>ce <strong>de</strong> moy<strong>en</strong>nes <strong>en</strong>tre . les <strong>de</strong>ux échantillons. t2 est la valeur <strong>de</strong>"t" calculée pour la différ<strong>en</strong>ce <strong>de</strong> moy<strong>en</strong>nes <strong>en</strong>tre le pré-test et le post-test pour chacun <strong>de</strong>s groupes. D'un point <strong>de</strong> vue global, nous pouvons constater que la différ<strong>en</strong>ee <strong>en</strong>tre les moy<strong>en</strong>nes du groupe expérim<strong>en</strong>tal et du groupe témoin au pré-test est significative à 70%. De même est significative à plus <strong>de</strong> 70% la différ<strong>en</strong>ce <strong>de</strong> moy<strong>en</strong>nes du groupe expérim<strong>en</strong>tal <strong>en</strong>tre le pré-test et le post-test. Par ailleurs, les résultats du groupe témoin au prétest et au post-test n'ont pas changé significativem<strong>en</strong>t; <strong>en</strong> effet, le hasard seul nous donne <strong>de</strong>s variations pl us importantes dans 80% <strong>de</strong>s cas. Ces résultats suggèr<strong>en</strong>t la conclusion suivante. Le groupe expérim<strong>en</strong>tal semble accuser au niveau pré-test un retard sur le groupe té-
- Page 1 and 2:
UNIVERSITE DU QUEBEC EN ABITIBI-TEM
- Page 3 and 4: REMERCIEMENTS Je tiens à manifeste
- Page 5 and 6: LISTE DES TABLEAUX Page TABLEAU I -
- Page 7 and 8: LISTES DES GRAPHIQUES Page GRAPHIQU
- Page 9 and 10: 2 Dans nos résultats, une réponse
- Page 11 and 12: 4 une classe d'adaptation en premi
- Page 13 and 14: 6 Unité d 1 action. Complémentari
- Page 15 and 16: 8 tifs était la réinsertion de 1
- Page 17 and 18: 10 socio-affective? Une chose est c
- Page 19 and 20: 12 "La socialisation, c'est de rend
- Page 21 and 22: 14 nes impliquées dans ce processu
- Page 23 and 24: 16 points de vue. Un bon climat soc
- Page 25 and 26: 18 Utiliser cette méthode de trava
- Page 27 and 28: 20 gnement individualisé~ Freinet
- Page 29 and 30: ·~ { TABLEAU I PROGRAMME DE DÉVEL
- Page 31 and 32: PROGRAMME DE DÉVELOPPEMENT AFFECTI
- Page 33 and 34: 26 But et limites de l a recherche
- Page 35 and 36: TABLEAU II c--P'~ Co:1sci cne c ini
- Page 37 and 38: 30 Elaboration d'un instrument de m
- Page 39 and 40: 32 C. L'enfant doit s'accepter tel
- Page 41 and 42: 34 G. La compréhension qu'a l'enfa
- Page 43 and 44: 36 compétences. Ces séances devai
- Page 45 and 46: 38 Jeudi Vendredi: Comportement né
- Page 47 and 48: 40 9ième semaine - "Mes capacités
- Page 49 and 50: 42 Jeudi Vendredi: Que pourrais-je
- Page 51 and 52: CHAPITRE II PRESENTATION DES RESULT
- Page 53: 46 écart-type de 1 'échantillon 1
- Page 57 and 58: 50 "' ,, n. 0 tb "' ., " 'C .. ., .
- Page 59 and 60: 52 Baisses de réponses positives E
- Page 61 and 62: 54 dans le groupe expérimental ou
- Page 63 and 64: 56 TABLEAU XII Augmentation de 20,1
- Page 65 and 66: 58 Baisses de 20% et plus Cette der
- Page 67 and 68: 60 t 2 est la valeur de 11 t 11 cal
- Page 69 and 70: GRAPHIQUE II Graphique comparati f
- Page 71 and 72: 64 Pour cet objectif, nous remarquo
- Page 73 and 74: 66 Pour cette deuxième série d'é
- Page 75 and 76: GRAPHIQUE Graphique comparatif des
- Page 77 and 78: 70 Ici, nous parlerons du développ
- Page 79 and 80: 72 Groupe E Pour le cinquième obje
- Page 81 and 82: GRAPHIQUE VI 74 Gra phique comparat
- Page 83 and 84: 76 Le tableau suivant présente les
- Page 85 and 86: 78 Pré-test TABLEA U XXI Va Param
- Page 87 and 88: GRAPHIQUE VIII Graphique corr.parat
- Page 89 and 90: CHAPITRE III ANALYSE ET INTERPRETAT
- Page 91 and 92: 84 Augm. de Références Numéro En
- Page 93 and 94: 86 à les écouter parler d'eux-mê
- Page 95 and 96: 88 Prenons 1•énoncé 29 où 1•
- Page 97 and 98: 90 20,3 en faveur du groupe témoin
- Page 99 and 100: 92 seulement sont représentés. Le
- Page 101 and 102: 94 Trois de ces énoncés sont à c
- Page 103 and 104: 96 les comportements non socialemen
- Page 105 and 106:
98 Groupe A Cette série d'énoncé
- Page 107 and 108:
CONCLUSION Au cours de ce travail,
- Page 109 and 110:
102 vécu de cette expérience, nou
- Page 111 and 112:
BIBLIOGRAPHIE Volumes Ball, Gérald
- Page 113 and 114:
106 Vuillet, Jean. La coopération
- Page 115 and 116:
108 1 2 Questionnaire sur la social
- Page 117 and 118:
110 13- Je voudrais savoir ce qui f
- Page 119 and 120:
112 37- Je pense réussir dans la v
- Page 121 and 122:
ANNEXE II
- Page 123 and 124:
116 Augmentation de 0,1% à 5% Nous
- Page 125 and 126:
118 Baisses entre 0,1% et 5% Au tab