- Page 1 and 2:
SOCIOLINGUISTIC SURVEY OF NORTHERN
- Page 3 and 4:
National Institute of Pakistani Stu
- Page 5 and 6:
CONTENTS Preface...................
- Page 7 and 8:
PREFACE The northern area of Pakist
- Page 9:
MAPS
- Page 14 and 15:
xiv Introduction Dardic and Nurista
- Page 16 and 17:
xvi Introduction the younger genera
- Page 19 and 20:
Acknowledgments for the Series ACKN
- Page 21 and 22:
Acknowledgments xxi Acknowledgments
- Page 23:
THE LANGUAGE ENVIRONMENT OF HINDKO-
- Page 26 and 27:
4 Calvin R. Rensch The term Hindki
- Page 28 and 29:
6 Calvin R. Rensch Reflecting these
- Page 30 and 31:
8 Calvin R. Rensch Some added that
- Page 32 and 33:
10 4. Western Salt Range (N. Shahpu
- Page 34 and 35:
12 Calvin R. Rensch Sherpur, a more
- Page 36 and 37:
14 (1.2) Adult Population of Jammun
- Page 38 and 39:
16 Calvin R. Rensch (1.4) Adult Pop
- Page 40 and 41:
18 Men Age (1.5) Adult Population o
- Page 42 and 43:
20 Men Age Calvin R. Rensch (1.6) H
- Page 44 and 45:
22 Men Age (1.7) Sampling of Male P
- Page 46 and 47:
24 Calvin R. Rensch (2.1) Languages
- Page 48 and 49:
26 Calvin R. Rensch visited Abbotta
- Page 50 and 51:
28 Calvin R. Rensch language used w
- Page 52 and 53:
30 Calvin R. Rensch Patterns of tra
- Page 54 and 55:
32 Calvin R. Rensch figure is highe
- Page 56 and 57:
34 Calvin R. Rensch residents were
- Page 58 and 59:
36 Calvin R. Rensch Fewer responden
- Page 60 and 61:
38 Calvin R. Rensch In the home the
- Page 62 and 63:
40 Calvin R. Rensch the sentences i
- Page 64 and 65:
42 Calvin R. Rensch (3.2) Percentag
- Page 66 and 67:
44 Calvin R. Rensch Although the nu
- Page 68 and 69:
46 Calvin R. Rensch in Sherpur, at
- Page 70 and 71:
48 Calvin R. Rensch to travel outsi
- Page 72 and 73:
50 Calvin R. Rensch The percentage
- Page 74 and 75:
52 Calvin R. Rensch once lived in t
- Page 76 and 77:
54 Calvin R. Rensch Word lists were
- Page 78 and 79:
56 Calvin R. Rensch city dialects h
- Page 80 and 81:
58 Calvin R. Rensch (4.3) Lexical S
- Page 82 and 83:
60 Calvin R. Rensch (4.4) Recorded
- Page 84 and 85:
62 Calvin R. Rensch below seventy p
- Page 86 and 87:
64 Calvin R. Rensch Respondents in
- Page 88 and 89:
66 Calvin R. Rensch Garhi or Balako
- Page 90 and 91:
68 Calvin R. Rensch (5.3) Responses
- Page 92 and 93:
70 Calvin R. Rensch (5.4b) Response
- Page 94 and 95:
72 Calvin R. Rensch to the fact tha
- Page 96 and 97:
74 Calvin R. Rensch poetry and perh
- Page 98 and 99:
76 Calvin R. Rensch (5.7) Responses
- Page 100 and 101:
78 Calvin R. Rensch stable bilingua
- Page 102 and 103:
80 Calvin R. Rensch From figure (6.
- Page 104 and 105:
82 Calvin R. Rensch (6.4) Percentag
- Page 106 and 107:
84 Calvin R. Rensch (6.6) Average R
- Page 108 and 109:
86 Calvin R. Rensch (6.8) Attitudes
- Page 110 and 111:
88 Calvin R. Rensch of a rather con
- Page 113 and 114: DIALECT VARIATION AND MULTILINGUALI
- Page 115 and 116: Gujari 93 1.2 Language Classificati
- Page 117 and 118: Gujari 95 Ephthalites (or White Hun
- Page 119 and 120: Gujari 97 Kashmir, Himachal Pradesh
- Page 121 and 122: Gujari 99 1.6 Socioeconomic Status
- Page 123 and 124: Gujari 101 help to promote Gujari l
- Page 125 and 126: Gujari 103 CHAPTER 2 DIALECTS OF GU
- Page 127 and 128: Gujari 105 1. Kunar Gujari (Kunar P
- Page 129 and 130: Gujari 107 Three word lists were el
- Page 131 and 132: Gujari 109 2.2.3 Other Linguistic V
- Page 133 and 134: Gujari 111 Figure (1) Lexical simil
- Page 135 and 136: Gujari 113 These indicators include
- Page 137 and 138: Gujari 115 2.2.6 Additional Compari
- Page 139 and 140: Gujari 117 definite lexical evidenc
- Page 141 and 142: Gujari 119 Figure (2) Mean Scores o
- Page 143 and 144: Gujari 121 means for the Western di
- Page 145 and 146: Gujari 123 varieties have not been
- Page 147 and 148: Gujari 125 exposure to Urdu was men
- Page 149 and 150: Gujari 127 is clearly some loss of
- Page 151 and 152: Gujari 129 CHAPTER 3 PROFILES OF TW
- Page 153 and 154: Gujari 131 Age in Years (1) Populat
- Page 155 and 156: Gujari 133 There is electricity in
- Page 157 and 158: Gujari 135 eight. The medium of ins
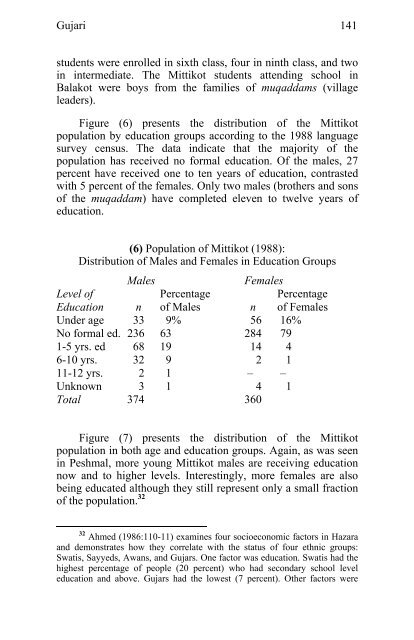
- Page 159 and 160: Gujari 137 (4) Population of Mittik
- Page 161: Gujari 139 down to Balakot where th
- Page 165 and 166: Gujari 143 3.5 Summary In this exam
- Page 167 and 168: Gujari 145 CHAPTER 4 MULTILINGUALIS
- Page 169 and 170: Gujari 147 and women will be discus
- Page 171 and 172: Gujari 149 much more difficult to c
- Page 173 and 174: Gujari 151 The significant effect o
- Page 175 and 176: Gujari 153 untraveled groups. In an
- Page 177 and 178: Gujari 155 (12) Peshmal men: report
- Page 179 and 180: Gujari 157 conversation which exten
- Page 181 and 182: Gujari 159 (15) Peshmal female subj
- Page 183 and 184: Gujari 161 identical, there is no c
- Page 185 and 186: Gujari 163 the case that younger me
- Page 187 and 188: Gujari 165 (17) Peshmal male subjec
- Page 189 and 190: Gujari 167 water; business, jobs, a
- Page 191 and 192: Gujari 169 did not exhibit a unifor
- Page 193 and 194: Gujari 171 4.3 Multilingualism in M
- Page 195 and 196: Gujari 173 Education and Urdu Profi
- Page 197 and 198: Gujari 175 4.3.3 Reported Use of Ur
- Page 199 and 200: Gujari 177 Urdu more often, in cont
- Page 201 and 202: Gujari 179 sample of fifty-two men
- Page 203 and 204: Gujari 181 showing a mean increase
- Page 205 and 206: Gujari 183 On the basis of the Hind
- Page 207 and 208: Gujari 185 The frequency reports gi
- Page 209 and 210: Gujari 187 one to five years educat
- Page 211 and 212: Gujari 189 4.4.2 Relative Proficien
- Page 213 and 214:
Gujari 191 (29) Mittikot men: Hindk
- Page 215 and 216:
Gujari 193 In comparison with women
- Page 217:
APPENDICES
- Page 220 and 221:
198 Appendix A Methodologies (1) Ca
- Page 222 and 223:
200 Appendix A Methodologies A.1.2
- Page 224 and 225:
202 Appendix A Methodologies 100. s
- Page 226 and 227:
204 Appendix A Methodologies 196. t
- Page 228 and 229:
206 Appendix A Methodologies Thus t
- Page 230 and 231:
208 Appendix A Methodologies repres
- Page 232 and 233:
210 Appendix A Methodologies the re
- Page 234 and 235:
212 Appendix B Hindko Survey Data 4
- Page 236 and 237:
214 Appendix B Hindko Survey Data 2
- Page 238 and 239:
216 Appendix B Hindko Survey Data 4
- Page 240 and 241:
218 Appendix B Hindko Survey Data 5
- Page 242 and 243:
220 Appendix B Hindko Survey Data 7
- Page 244 and 245:
222 Appendix B Hindko Survey Data 9
- Page 246 and 247:
224 Appendix B Hindko Survey Data 1
- Page 248 and 249:
226 Appendix B Hindko Survey Data 1
- Page 250 and 251:
228 Appendix B Hindko Survey Data 1
- Page 252 and 253:
230 Appendix B Hindko Survey Data 1
- Page 254 and 255:
232 Appendix B Hindko Survey Data 1
- Page 256 and 257:
234 Appendix B Hindko Survey Data 2
- Page 258 and 259:
236 Appendix B Hindko Survey Data 1
- Page 260 and 261:
238 Balakot Story B.2.2 Hindko, Bal
- Page 262 and 263:
240 Appendix B Hindko Survey Data Q
- Page 264 and 265:
242 Appendix B Hindko Survey Data 1
- Page 266 and 267:
244 Appendix B Hindko Survey Data 1
- Page 268 and 269:
246 Peshawar Story B.2.5 Hindko, Pe
- Page 270 and 271:
248 Appendix B Hindko Survey Data Q
- Page 272 and 273:
250 Appendix B Hindko Survey Data 1
- Page 274 and 275:
252 Appendix B Hindko Survey Data 1
- Page 276 and 277:
254 Appendix B Hindko Survey Data 1
- Page 278 and 279:
256 Travel Questions Appendix B.3 H
- Page 281 and 282:
APPENDIX C GUJARI SURVEY DATA Appen
- Page 283 and 284:
C.1 Gujari Word Lists 261 13. arm 1
- Page 285 and 286:
C.1 Gujari Word Lists 263 31. morta
- Page 287 and 288:
C.1 Gujari Word Lists 265 49. light
- Page 289 and 290:
C.1 Gujari Word Lists 267 67. mango
- Page 291 and 292:
C.1 Gujari Word Lists 269 85. fat 8
- Page 293 and 294:
C.1 Gujari Word Lists 271 103. woma
- Page 295 and 296:
C.1 Gujari Word Lists 273 121. even
- Page 297 and 298:
C.1 Gujari Word Lists 275 139. left
- Page 299 and 300:
C.1 Gujari Word Lists 277 157. seve
- Page 301 and 302:
C.1 Gujari Word Lists 279 175. same
- Page 303 and 304:
C.1 Gujari Word Lists 281 190. (you
- Page 305 and 306:
C.1 Gujari Word Lists 283 208. we (
- Page 307 and 308:
C.2.1 Chitral Gujari Text 285 10. m
- Page 309 and 310:
Peshmal Story C.2.2 Swat Gujari, (P
- Page 311 and 312:
C.2.2 Swat Gujari Text 289 Question
- Page 313 and 314:
C.2.3 Gilgit Gujari Text 291 12. d
- Page 315 and 316:
Mittikot Story C.2.4 Kaghan Gujari,
- Page 317 and 318:
C.2.4 Kaghan Gujari Text 295 24. jV
- Page 319 and 320:
C.2.5 Central Azad Kashmir Gujari T
- Page 321 and 322:
C.2.5 Central Azad Kashmir Gujari T
- Page 323 and 324:
C.2.5 Central Azad Kashmir Gujari T
- Page 325 and 326:
REFERENCES FOR HINDKO 303 Addleton,
- Page 327:
References for Gujari 305 Masica, C