- Page 1 and 2:
AN OVERVIEW OF THE IMPACT OF MINING
- Page 3 and 4:
AN OVERVIEW OF THE IMPACT OF MINING
- Page 5 and 6:
exploited, the size of the facility
- Page 7 and 8:
2.3.6 Stockpiling and transport of
- Page 9 and 10:
4.1.6 Mining and mineral processing
- Page 11 and 12:
LIST OF FIGURES Figure 1.1: Compari
- Page 13 and 14:
Table 1.6: Minimum annual productio
- Page 15 and 16:
Table 3.26: Mining operations in th
- Page 17 and 18:
Table 4.22: Mining operations in th
- Page 19 and 20:
ACKNOWLEDGEMENTS Several enthusiast
- Page 21 and 22:
1. INTRODUCTION AND BACKGROUND INFO
- Page 23 and 24:
Box 1.2). Each research team is req
- Page 25 and 26:
The MRC cannot be held responsible
- Page 27 and 28:
of amenity or deterioration in wate
- Page 29 and 30:
Typically, river flows in the count
- Page 31 and 32:
In simple terms, all of the propone
- Page 33 and 34:
shared by more than one country, es
- Page 35 and 36:
most appropriate technical or inves
- Page 37 and 38:
CAMEROUN GABON CENTRAL AFRICAN REPU
- Page 39 and 40:
1.6.1 Data on the location, nature,
- Page 41 and 42:
1997). In future studies, more atte
- Page 43 and 44:
Section 5 briefly reviews the water
- Page 45 and 46:
Mining methods vary widely and depe
- Page 47 and 48:
Removal and storage of ores and was
- Page 49 and 50:
These effects are usually ameliorat
- Page 51 and 52:
Water quality changes are widely co
- Page 53 and 54:
these substances are often mobilize
- Page 55 and 56:
The acidification of the water has
- Page 57 and 58:
and kinetic stability of the comple
- Page 59 and 60:
This process is carefully balanced
- Page 61 and 62:
neutralize each other - this situat
- Page 63 and 64:
(Chenje, 2000). Despite the recent
- Page 65 and 66:
Swaziland Water Environment Tanzani
- Page 67 and 68: Draft Environmental Management Bill
- Page 69 and 70: siting of works plan for approval t
- Page 71 and 72: The draft policy encourages develop
- Page 73 and 74: provides a definition but one which
- Page 75 and 76: 2.9.3.9 Zimbabwe Environmental Impa
- Page 77 and 78: Sector Activity Industry °Chemical
- Page 79 and 80: Cyanides and related compounds (CN)
- Page 81 and 82: of Natural Resources and the South
- Page 83 and 84: 3.1.1 Geology, topography and soils
- Page 85 and 86: Air temperatures across the Zambezi
- Page 87 and 88: or fuelwood production. Similar pat
- Page 89 and 90: Zambia. Clearly, some water quality
- Page 91 and 92: 3.2.1.6 Human impacts on water reso
- Page 93 and 94: The Botswana segment of this area f
- Page 95 and 96: 3.4.1.4 Surface water users The onl
- Page 97 and 98: 3.5.1.2 Geology The Upper Karoo Bat
- Page 99 and 100: 3.5.6 Implications for water qualit
- Page 101 and 102: 3.6.4 Monitoring systems None. 3.6.
- Page 103 and 104: 3.7.2 Mining and mineral processing
- Page 105 and 106: 3.8.1.5 Water management systems Th
- Page 107 and 108: 3.9.1.2 Geology This sub-catchment
- Page 109 and 110: 3.9.5 Water quality data None avail
- Page 111 and 112: Z-87 Mulobezi Amethyst Operating Ve
- Page 113 and 114: 3.11.1.6 Human impacts on water res
- Page 115 and 116: 3.12.1.2 Geology This sub-catchment
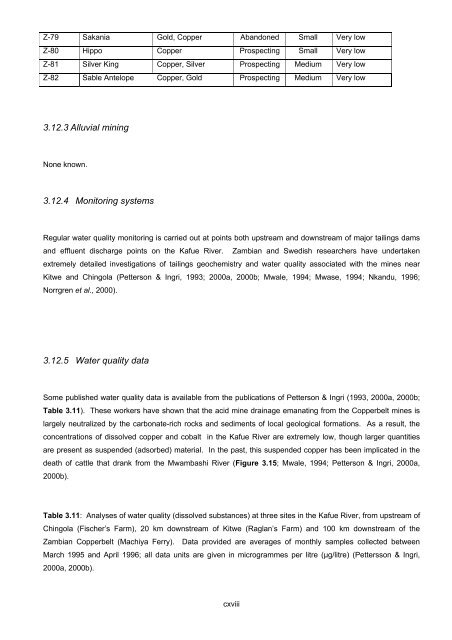
- Page 117: • Increased quantities of suspend
- Page 121 and 122: 3.13.1.4 Surface water users There
- Page 123 and 124: The Nampundwe pyrite mine poses a r
- Page 125 and 126: Z-90 Chisuki Mica, Tin, Tantalite O
- Page 127 and 128: along the major roads between Chiru
- Page 129 and 130: 3.16.1 General description 3.16.1.1
- Page 131 and 132: Z-17 Jessie Gold Starting Very Smal
- Page 133 and 134: Small intrusions of Greenstone form
- Page 135 and 136: Several stretches of streams and ri
- Page 137 and 138: 3.18.1.5 Water management systems T
- Page 139 and 140: 3.18.6 Implications for water quali
- Page 141 and 142: 3.19.1.6 Human impacts on water res
- Page 143 and 144: 3.20 The Mazowe (Mozambique) sub-ca
- Page 145 and 146: 3.20.4 Monitoring systems This area
- Page 147 and 148: Table 3.21: Mining operations in th
- Page 149 and 150: The only settlements of any size ar
- Page 151 and 152: 3.23.1 General description 3.23.1.1
- Page 153 and 154: 3.23.4 Monitoring systems None. 3.2
- Page 155 and 156: • Non-point impact from minefield
- Page 157 and 158: This is Zones G1-G6, B1-B3, S1-S6,
- Page 159 and 160: The catchment falls mainly under th
- Page 161 and 162: The two lone water quality data poi
- Page 163 and 164: • Non-point domestic effluent, ru
- Page 165 and 166: Land use comprises the Siabuwa, Oma
- Page 167 and 168: 3.28 The Ume sub-catchment 3.28.1 G
- Page 169 and 170:
3.28.4 Monitoring systems None. 3.2
- Page 171 and 172:
3.29.1.4 Surface water users The Ci
- Page 173 and 174:
Thristle Etna Gold 6.7 Medium Tiger
- Page 175 and 176:
Sanyati, all may well contribute or
- Page 177 and 178:
3.30.1.5 Water management systems T
- Page 179 and 180:
This is Zone Z1 of Area C (ZSG, 198
- Page 181 and 182:
3.31.5 Water quality data Only one
- Page 183 and 184:
3.32.2 Mining and mineral processin
- Page 185 and 186:
Land use above the Zambezi Escarpme
- Page 187 and 188:
Extensive alluvial mining of gold t
- Page 189 and 190:
The major settlements are the metro
- Page 191 and 192:
3.34.6 Implications for water quali
- Page 193 and 194:
• Urban run off, urban areas of C
- Page 195 and 196:
3.36.1.4 Surface water users The to
- Page 197 and 198:
3.37.1.1 Hydrology This is Zones M1
- Page 199 and 200:
The catchment falls under the Harar
- Page 201 and 202:
3.37.3 Alluvial mining Alluvial min
- Page 203 and 204:
widely intruded by Mashonaland Dole
- Page 205 and 206:
3.38.4 Monitoring systems ZINWA is
- Page 207 and 208:
3.39.2 Mining and mineral processin
- Page 209 and 210:
4. THE LIMPOPO BASIN In order to pr
- Page 211 and 212:
Mountains. Most of the basin consis
- Page 213 and 214:
the City of Pretoria and the northe
- Page 215 and 216:
continues to flow in the deeper all
- Page 217 and 218:
Each basin state maintains its own
- Page 219 and 220:
Land use in the upper parts of the
- Page 221 and 222:
the Limpopo River some 100 kilometr
- Page 223 and 224:
None obtainable in time for this re
- Page 225 and 226:
4.4.2 Mining and mineral processing
- Page 227 and 228:
In the Botswana sector of the sub-c
- Page 229 and 230:
4.5.5 Water quality data None avail
- Page 231 and 232:
4.6.5 Water quality data None avail
- Page 233 and 234:
Table 4.9: Mining operations in the
- Page 235 and 236:
4.7.4 Monitoring systems ZINWA is c
- Page 237 and 238:
There is exploration for diamonds (
- Page 239 and 240:
There is exploration, mainly for di
- Page 241 and 242:
4.10.2 Mining and mineral processin
- Page 243 and 244:
Hwange National Park (ZSG, 1998). A
- Page 245 and 246:
4.12.1.3 Pedology, agriculture and
- Page 247 and 248:
4.13 The Marico sub-catchment 4.13.
- Page 249 and 250:
• Major non-point impact of agric
- Page 251 and 252:
Several thermal springs are located
- Page 253 and 254:
• Disposal of large volumes of li
- Page 255 and 256:
D7-13 Premier Diamond - kimberlite
- Page 257 and 258:
4.15.1 General description 4.15.1.1
- Page 259 and 260:
4.15.2 Mining and mineral processin
- Page 261 and 262:
Most of the clayey loam soils in th
- Page 263 and 264:
4.17 The Theuniskloof sub-catchment
- Page 265 and 266:
4.17.4 Monitoring systems The Depar
- Page 267 and 268:
4.18.1.4 Surface water users All of
- Page 269 and 270:
Water quality data for three sites
- Page 271 and 272:
supplies in the sub-catchment, the
- Page 273 and 274:
4.20.1.2 Geology Like the Mogalakwe
- Page 275 and 276:
• Minor non-point impact from non
- Page 277 and 278:
4.21 The Nzhelele sub-catchment 4.2
- Page 279 and 280:
4.21.1.6 Human impacts on water res
- Page 281 and 282:
4.22.1.3 Pedology, agriculture and
- Page 283 and 284:
Code Number Name of Mine Commodity
- Page 285 and 286:
5. THE OLIFANTS CATCHMENT In order
- Page 287 and 288:
Soil formations across the Olifants
- Page 289 and 290:
indices of per capita agricultural
- Page 291 and 292:
professional capacity within the me
- Page 293 and 294:
• Dark grey to blackish, mottled
- Page 295 and 296:
5.2.5 Water quality data No specifi
- Page 297 and 298:
Several towns (e.g. Witbank and Mid
- Page 299 and 300:
The following mining operations are
- Page 301 and 302:
5.3.6 Implications for water qualit
- Page 303 and 304:
5.4.1.3 Pedology, agriculture and l
- Page 305 and 306:
K 5.5 5 4.5 Cl 380 350 200 F 1.0 1.
- Page 307 and 308:
local geological formations. High c
- Page 309 and 310:
The South African Department of Wat
- Page 311 and 312:
pH 8.5 8.3 8.8 8.7 8.8 8.9 TDS 439
- Page 313 and 314:
Soils in the sub-catchment can be d
- Page 315 and 316:
No information is available on the
- Page 317 and 318:
In its upper reaches, the sub-catch
- Page 319 and 320:
The Phalaborwa Water Board has been
- Page 321 and 322:
m 3 /day) water abstractions, and m
- Page 323 and 324:
In the south-west of the sub-catchm
- Page 325 and 326:
• Minor non-point impact of agric
- Page 327 and 328:
(Figure 4.2). The tributaries of th
- Page 329 and 330:
5.9.1.6 Human impacts on water reso
- Page 331 and 332:
y the upper Klaserie River. Recent
- Page 333 and 334:
5.10.6 Implications for water quali
- Page 335 and 336:
In Mozambique, the Mozambican Depar
- Page 337 and 338:
Acid mine drainage (AMD) represents
- Page 339 and 340:
• Antimony, cadmium and tin conta
- Page 341 and 342:
• Decreased light penetration to
- Page 343 and 344:
6.1.8 “Peripheral” or indirect
- Page 345 and 346:
Worldwide, the general public has e
- Page 347 and 348:
2. That copies of this report shoul
- Page 349 and 350:
Banks, D., P.L. Younger, R.T. Arnes
- Page 351 and 352:
CSIR (1993). An Environmental Impac
- Page 353 and 354:
Fuggle, R.F. & M.A. Rabie (1996). E
- Page 355 and 356:
Love, D. & D.K. Hallbauer (2000). M
- Page 357 and 358:
Pettersson, U.T. & J. Ingri (2000b)
- Page 359 and 360:
Turton, A.R. (1999b). Water scarcit
- Page 361 and 362:
World Bank (1998). World Developmen


