

London Wider Waste Strategy - London - Greater London Authority
London Wider Waste Strategy - London - Greater London Authority
London Wider Waste Strategy - London - Greater London Authority

Create successful ePaper yourself
Turn your PDF publications into a flip-book with our unique Google optimized e-Paper software.
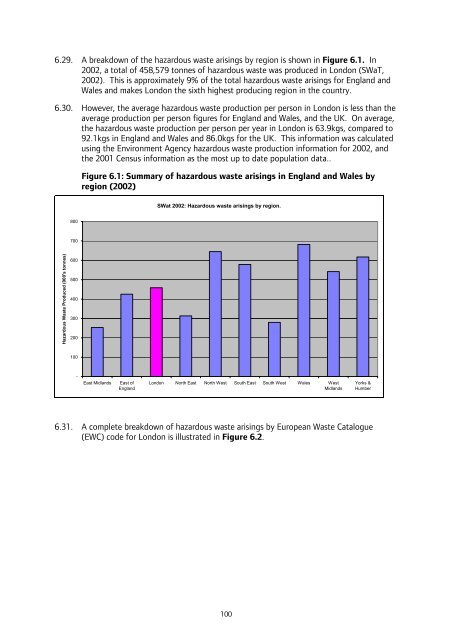
6.29. A breakdown of the hazardous waste arisings by region is shown in Figure 6.1. In<br />
2002, a total of 458,579 tonnes of hazardous waste was produced in <strong>London</strong> (SWaT,<br />
2002). This is approximately 9% of the total hazardous waste arisings for England and<br />
Wales and makes <strong>London</strong> the sixth highest producing region in the country.<br />
6.30. However, the average hazardous waste production per person in <strong>London</strong> is less than the<br />
average production per person figures for England and Wales, and the UK. On average,<br />
the hazardous waste production per person per year in <strong>London</strong> is 63.9kgs, compared to<br />
92.1kgs in England and Wales and 86.0kgs for the UK. This information was calculated<br />
using the Environment Agency hazardous waste production information for 2002, and<br />
the 2001 Census information as the most up to date population data..<br />
Hazardous <strong>Waste</strong> Produced (000's tonnes)<br />
800<br />
700<br />
600<br />
500<br />
400<br />
300<br />
200<br />
100<br />
-<br />
Figure 6.1: Summary of hazardous waste arisings in England and Wales by<br />
region (2002)<br />
East Midlands East of<br />
England<br />
SWat 2002: Hazardous waste arisings by region.<br />
<strong>London</strong> North East North West South East South West Wales West<br />
Midlands<br />
Yorks &<br />
Humber<br />
6.31. A complete breakdown of hazardous waste arisings by European <strong>Waste</strong> Catalogue<br />
(EWC) code for <strong>London</strong> is illustrated in Figure 6.2.<br />
100


