

London Wider Waste Strategy - London - Greater London Authority
London Wider Waste Strategy - London - Greater London Authority
London Wider Waste Strategy - London - Greater London Authority

Create successful ePaper yourself
Turn your PDF publications into a flip-book with our unique Google optimized e-Paper software.
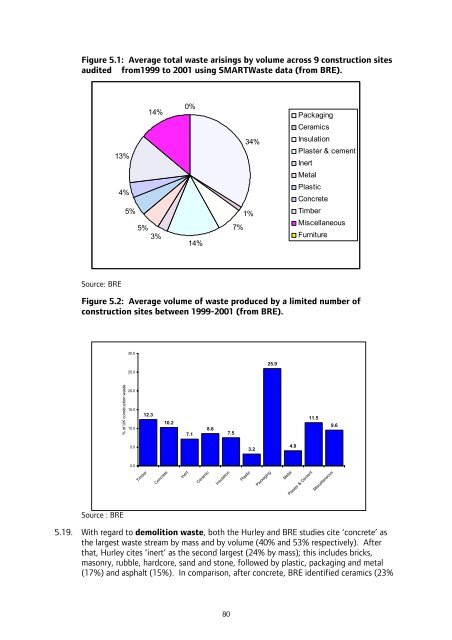
Figure 5.1: Average total waste arisings by volume across 9 construction sites<br />
audited from1999 to 2001 using SMART<strong>Waste</strong> data (from BRE).<br />
Source: BRE<br />
13%<br />
4%<br />
5%<br />
14%<br />
5%<br />
3%<br />
0%<br />
14%<br />
7%<br />
34%<br />
1%<br />
Packaging<br />
Ceramics<br />
Insulation<br />
Plaster & cement<br />
Inert<br />
Metal<br />
Plastic<br />
Concrete<br />
Timber<br />
Miscellaneous<br />
Furniture<br />
Figure 5.2: Average volume of waste produced by a limited number of<br />
construction sites between 1999-2001 (from BRE).<br />
% of UK construction waste<br />
Source : BRE<br />
30.0<br />
25.0<br />
20.0<br />
15.0<br />
10.0<br />
5.0<br />
0.0<br />
Timber<br />
12.3<br />
Concrete<br />
10.2<br />
Inert<br />
7.1<br />
Ceramic<br />
8.6<br />
Insulation<br />
7.5<br />
Plastic<br />
3.2<br />
Packaging<br />
25.9<br />
Metal<br />
4.0<br />
Plaster & Cement<br />
11.5<br />
Miscellaneous<br />
5.19. With regard to demolition waste, both the Hurley and BRE studies cite ‘concrete’ as<br />
the largest waste stream by mass and by volume (40% and 53% respectively). After<br />
that, Hurley cites ‘inert’ as the second largest (24% by mass); this includes bricks,<br />
masonry, rubble, hardcore, sand and stone, followed by plastic, packaging and metal<br />
(17%) and asphalt (15%). In comparison, after concrete, BRE identified ceramics (23%<br />
80<br />
9.6


