

London Wider Waste Strategy - London - Greater London Authority
London Wider Waste Strategy - London - Greater London Authority
London Wider Waste Strategy - London - Greater London Authority

You also want an ePaper? Increase the reach of your titles
YUMPU automatically turns print PDFs into web optimized ePapers that Google loves.
and <strong>London</strong> regions currently being undertaken by M.E.L Research should assist in<br />
providing a clearer picture of the amount of commercial and industrial waste that is<br />
managed outside of <strong>London</strong>.<br />
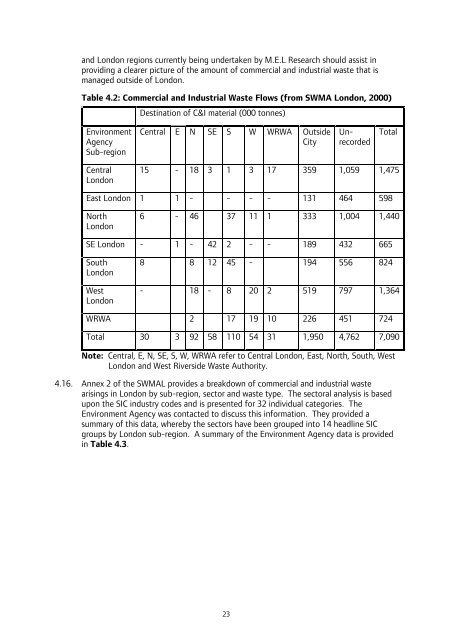
Table 4.2: Commercial and Industrial <strong>Waste</strong> Flows (from SWMA <strong>London</strong>, 2000)<br />
Environment<br />
Agency<br />
Sub-region<br />
Central<br />
<strong>London</strong><br />
Destination of C&I material (000 tonnes)<br />
Central E N SE S W WRWA Outside<br />
City<br />
Unrecorded<br />
Total<br />
15 - 18 3 1 3 17 359 1,059 1,475<br />
East <strong>London</strong> 1 1 - - - - 131 464 598<br />
North<br />
<strong>London</strong><br />
6 - 46 37 11 1 333 1,004 1,440<br />
SE <strong>London</strong> - 1 - 42 2 - - 189 432 665<br />
South<br />
<strong>London</strong><br />
West<br />
<strong>London</strong><br />
8 8 12 45 - 194 556 824<br />
- 18 - 8 20 2 519 797 1,364<br />
WRWA 2 17 19 10 226 451 724<br />
Total 30 3 92 58 110 54 31 1,950 4,762 7,090<br />
Note: Central, E, N, SE, S, W, WRWA refer to Central <strong>London</strong>, East, North, South, West<br />
<strong>London</strong> and West Riverside <strong>Waste</strong> <strong>Authority</strong>.<br />
4.16. Annex 2 of the SWMAL provides a breakdown of commercial and industrial waste<br />
arisings in <strong>London</strong> by sub-region, sector and waste type. The sectoral analysis is based<br />
upon the SIC industry codes and is presented for 32 individual categories. The<br />
Environment Agency was contacted to discuss this information. They provided a<br />
summary of this data, whereby the sectors have been grouped into 14 headline SIC<br />
groups by <strong>London</strong> sub-region. A summary of the Environment Agency data is provided<br />
in Table 4.3.<br />
23


