

London Wider Waste Strategy - London - Greater London Authority
London Wider Waste Strategy - London - Greater London Authority
London Wider Waste Strategy - London - Greater London Authority

You also want an ePaper? Increase the reach of your titles
YUMPU automatically turns print PDFs into web optimized ePapers that Google loves.
6.32. Approximately 73% (334,558 tonnes) of the hazardous waste arisings in <strong>London</strong><br />
originate from ‘construction and demolition waste and asbestos’. There is no further<br />
breakdown of this EWC group for the most recent (2002) SWaT data. However the<br />
2001 data is broken down further and indicates that of the 345,851 tonnes of<br />
hazardous C&D waste recorded in 2001, 235,641 (68%) was composed of soils and<br />
stones (EWC 170501) indicating that a high percentage of the hazardous waste in the<br />
‘construction and demolition and asbestos’ category comprises contaminated soils from<br />
the re-development of brownfield sites This concurs with the view expressed in the<br />
Environment Agency report ‘Hazardous <strong>Waste</strong> – A Growing Challenge’ 39 . The other<br />
main individual contributors towards hazardous waste arisings in <strong>London</strong> are:<br />
• oil and oil/water mixtures (~8%, 38,085 tonnes);<br />
• the waste water treatment and water industry (~7%, 33,198 tonnes); and<br />
• inorganic chemical processes (~2%, 9,974 tonnes).<br />
<strong>Waste</strong> Movement<br />
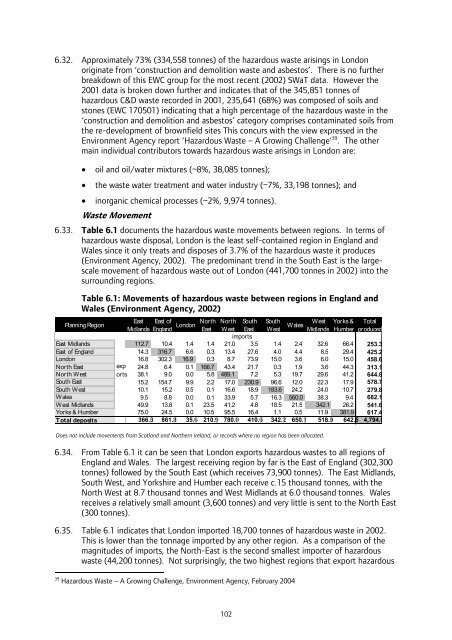
6.33. Table 6.1 documents the hazardous waste movements between regions. In terms of<br />
hazardous waste disposal, <strong>London</strong> is the least self-contained region in England and<br />
Wales since it only treats and disposes of 3.7% of the hazardous waste it produces<br />
(Environment Agency, 2002). The predominant trend in the South East is the largescale<br />
movement of hazardous waste out of <strong>London</strong> (441,700 tonnes in 2002) into the<br />
surrounding regions.<br />
Table 6.1: Movements of hazardous waste between regions in England and<br />
Wales (Environment Agency, 2002)<br />
Planning Region<br />
East East of North North<br />
<strong>London</strong><br />
Midlands England East West<br />
South<br />
East<br />
South<br />
West<br />
Wales<br />
West Yorks &<br />
Midlands Humber Total<br />
produced<br />
East Midlands<br />
East of England<br />
<strong>London</strong><br />
North East<br />
North West<br />
South East<br />
South W est<br />
Wales<br />
W est Midlands<br />
Yorks & Humber<br />
Total deposits<br />
imports<br />
112.7 10.4 1.4 1.4 21.0 3.5 1.4 2.4 32.6 66.4 253.3<br />
14.3 316.7 6.6 0.3 13.4 27.6 4.0 4.4 8.5 29.4 425.2<br />
16.8 302.3 16.9 0.3 8.7 73.9 15.0 3.6 6.0 15.0 458.6<br />
exp 24.8 6.4 0.1 166.7 43.4 21.7 0.3 1.9 3.6 44.3 313.1<br />
orts 38.1 9.0 0.0 5.8 489.1 7.2 5.3 19.7 29.6 41.2 644.8<br />
15.2 154.7 9.9 2.2 17.0 230.9 96.6 12.0 22.3 17.9 578.7<br />
10.1 15.2 0.5 0.1 16.6 18.9 183.6 24.2 24.0 10.7 279.8<br />
9.5 8.8 0.0 0.1 33.9 5.7 16.3 560.0 38.3 9.4 682.1<br />
49.9 13.8 0.1 23.5 41.2 4.8 18.5 21.5 342.1 26.2 541.6<br />
75.0 24.5 0.0 10.5 95.5 16.4 1.1 0.5 11.9 381.9 617.4<br />
366.3 861.8 35.6 210.9 780.0 410.6 342.2 650.1 518.9 642.5 4,794.6<br />
Does not include movements from Scotland and Northern Ireland, or records where no region has been allocated.<br />
6.34. From Table 6.1 it can be seen that <strong>London</strong> exports hazardous wastes to all regions of<br />
England and Wales. The largest receiving region by far is the East of England (302,300<br />
tonnes) followed by the South East (which receives 73,900 tonnes). The East Midlands,<br />
South West, and Yorkshire and Humber each receive c.15 thousand tonnes, with the<br />
North West at 8.7 thousand tonnes and West Midlands at 6.0 thousand tonnes. Wales<br />
receives a relatively small amount (3,600 tonnes) and very little is sent to the North East<br />
(300 tonnes).<br />
6.35. Table 6.1 indicates that <strong>London</strong> imported 18,700 tonnes of hazardous waste in 2002.<br />
This is lower than the tonnage imported by any other region. As a comparison of the<br />
magnitudes of imports, the North-East is the second smallest importer of hazardous<br />
waste (44,200 tonnes). Not surprisingly, the two highest regions that export hazardous<br />
39 Hazardous <strong>Waste</strong> – A Growing Challenge, Environment Agency, February 2004<br />
102


