

London Wider Waste Strategy - London - Greater London Authority
London Wider Waste Strategy - London - Greater London Authority
London Wider Waste Strategy - London - Greater London Authority

Create successful ePaper yourself
Turn your PDF publications into a flip-book with our unique Google optimized e-Paper software.
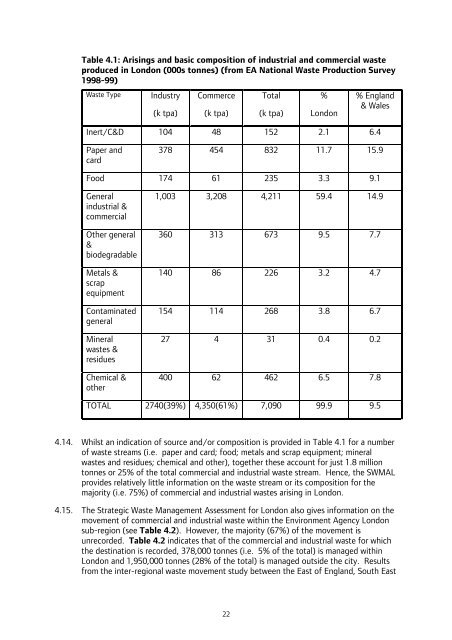
Table 4.1: Arisings and basic composition of industrial and commercial waste<br />
produced in <strong>London</strong> (000s tonnes) (from EA National <strong>Waste</strong> Production Survey<br />
1998-99)<br />
<strong>Waste</strong> Type Industry<br />
(k tpa)<br />
Commerce<br />
(k tpa)<br />
Total<br />
(k tpa)<br />
%<br />
<strong>London</strong><br />
% England<br />
& Wales<br />
Inert/C&D 104 48 152 2.1 6.4<br />
Paper and<br />
card<br />
378 454 832 11.7 15.9<br />
Food 174 61 235 3.3 9.1<br />
General<br />
industrial &<br />
commercial<br />
Other general<br />
&<br />
biodegradable<br />
Metals &<br />
scrap<br />
equipment<br />
Contaminated<br />
general<br />
Mineral<br />
wastes &<br />
residues<br />
Chemical &<br />
other<br />
1,003 3,208 4,211 59.4 14.9<br />
360 313 673 9.5 7.7<br />
140 86 226 3.2 4.7<br />
154 114 268 3.8 6.7<br />
27 4 31 0.4 0.2<br />
400 62 462 6.5 7.8<br />
TOTAL 2740(39%) 4,350(61%) 7,090 99.9 9.5<br />
4.14. Whilst an indication of source and/or composition is provided in Table 4.1 for a number<br />
of waste streams (i.e. paper and card; food; metals and scrap equipment; mineral<br />
wastes and residues; chemical and other), together these account for just 1.8 million<br />
tonnes or 25% of the total commercial and industrial waste stream. Hence, the SWMAL<br />
provides relatively little information on the waste stream or its composition for the<br />
majority (i.e. 75%) of commercial and industrial wastes arising in <strong>London</strong>.<br />
4.15. The Strategic <strong>Waste</strong> Management Assessment for <strong>London</strong> also gives information on the<br />
movement of commercial and industrial waste within the Environment Agency <strong>London</strong><br />
sub-region (see Table 4.2). However, the majority (67%) of the movement is<br />
unrecorded. Table 4.2 indicates that of the commercial and industrial waste for which<br />
the destination is recorded, 378,000 tonnes (i.e. 5% of the total) is managed within<br />
<strong>London</strong> and 1,950,000 tonnes (28% of the total) is managed outside the city. Results<br />
from the inter-regional waste movement study between the East of England, South East<br />
22


