

London Wider Waste Strategy - London - Greater London Authority
London Wider Waste Strategy - London - Greater London Authority
London Wider Waste Strategy - London - Greater London Authority

Create successful ePaper yourself
Turn your PDF publications into a flip-book with our unique Google optimized e-Paper software.
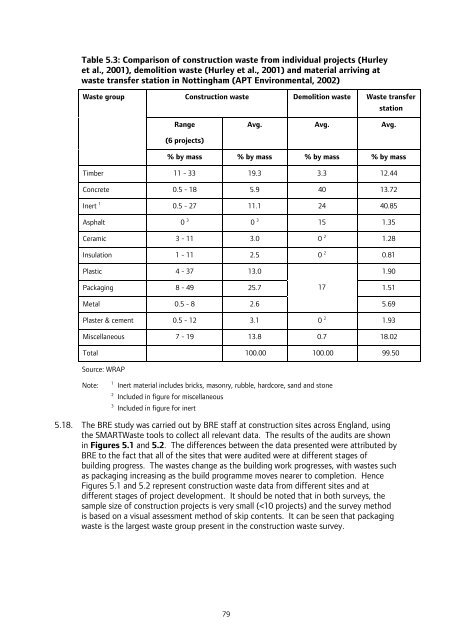
Table 5.3: Comparison of construction waste from individual projects (Hurley<br />
et al., 2001), demolition waste (Hurley et al., 2001) and material arriving at<br />
waste transfer station in Nottingham (APT Environmental, 2002)<br />
<strong>Waste</strong> group<br />
Range<br />
(6 projects)<br />
Construction waste Demolition waste <strong>Waste</strong> transfer<br />
station<br />
Avg. Avg. Avg.<br />
% by mass % by mass % by mass % by mass<br />
Timber 11 - 33 19.3 3.3 12.44<br />
Concrete 0.5 - 18 5.9 40 13.72<br />
Inert 1<br />
Asphalt 0 3<br />
0.5 - 27 11.1 24 40.85<br />
Ceramic 3 - 11 3.0 0 2<br />
Insulation 1 - 11 2.5 0 2<br />
0 3<br />
15 1.35<br />
Plastic 4 - 37 13.0 1.90<br />
Packaging 8 - 49 25.7 17<br />
1.51<br />
Metal 0.5 - 8 2.6<br />
Plaster & cement 0.5 - 12 3.1 0 2<br />
Miscellaneous 7 - 19 13.8 0.7 18.02<br />
Total 100.00 100.00 99.50<br />
Source: WRAP<br />
Note: 1 Inert material includes bricks, masonry, rubble, hardcore, sand and stone<br />
2 Included in figure for miscellaneous<br />
3 Included in figure for inert<br />
5.18. The BRE study was carried out by BRE staff at construction sites across England, using<br />
the SMART<strong>Waste</strong> tools to collect all relevant data. The results of the audits are shown<br />
in Figures 5.1 and 5.2. The differences between the data presented were attributed by<br />
BRE to the fact that all of the sites that were audited were at different stages of<br />
building progress. The wastes change as the building work progresses, with wastes such<br />
as packaging increasing as the build programme moves nearer to completion. Hence<br />
Figures 5.1 and 5.2 represent construction waste data from different sites and at<br />
different stages of project development. It should be noted that in both surveys, the<br />
sample size of construction projects is very small (


