

London Wider Waste Strategy - London - Greater London Authority
London Wider Waste Strategy - London - Greater London Authority
London Wider Waste Strategy - London - Greater London Authority

You also want an ePaper? Increase the reach of your titles
YUMPU automatically turns print PDFs into web optimized ePapers that Google loves.
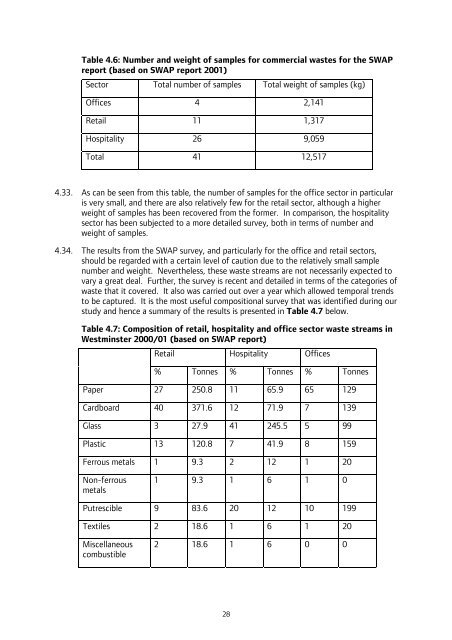
Table 4.6: Number and weight of samples for commercial wastes for the SWAP<br />
report (based on SWAP report 2001)<br />
Sector Total number of samples Total weight of samples (kg)<br />
Offices 4 2,141<br />
Retail 11 1,317<br />
Hospitality 26 9,059<br />
Total 41 12,517<br />
4.33. As can be seen from this table, the number of samples for the office sector in particular<br />
is very small, and there are also relatively few for the retail sector, although a higher<br />
weight of samples has been recovered from the former. In comparison, the hospitality<br />
sector has been subjected to a more detailed survey, both in terms of number and<br />
weight of samples.<br />
4.34. The results from the SWAP survey, and particularly for the office and retail sectors,<br />
should be regarded with a certain level of caution due to the relatively small sample<br />
number and weight. Nevertheless, these waste streams are not necessarily expected to<br />
vary a great deal. Further, the survey is recent and detailed in terms of the categories of<br />
waste that it covered. It also was carried out over a year which allowed temporal trends<br />
to be captured. It is the most useful compositional survey that was identified during our<br />
study and hence a summary of the results is presented in Table 4.7 below.<br />
Table 4.7: Composition of retail, hospitality and office sector waste streams in<br />
Westminster 2000/01 (based on SWAP report)<br />
Retail Hospitality Offices<br />
% Tonnes % Tonnes % Tonnes<br />
Paper 27 250.8 11 65.9 65 129<br />
Cardboard 40 371.6 12 71.9 7 139<br />
Glass 3 27.9 41 245.5 5 99<br />
Plastic 13 120.8 7 41.9 8 159<br />
Ferrous metals 1 9.3 2 12 1 20<br />
Non-ferrous<br />
metals<br />
1 9.3 1 6 1 0<br />
Putrescible 9 83.6 20 12 10 199<br />
Textiles 2 18.6 1 6 1 20<br />
Miscellaneous<br />
combustible<br />
2 18.6 1 6 0 0<br />
28


