

London Wider Waste Strategy - London - Greater London Authority
London Wider Waste Strategy - London - Greater London Authority
London Wider Waste Strategy - London - Greater London Authority

Create successful ePaper yourself
Turn your PDF publications into a flip-book with our unique Google optimized e-Paper software.
Total 100 598.8 70.7 423.4 29.8 178.4<br />
Notes: percentages are taken from the WASP report. Figures are rounded up.<br />
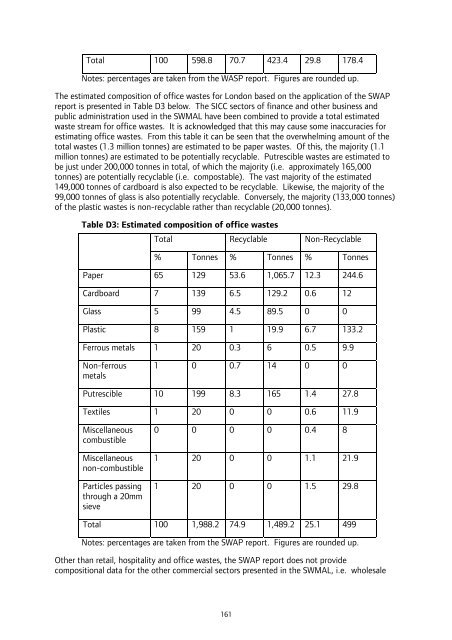
The estimated composition of office wastes for <strong>London</strong> based on the application of the SWAP<br />
report is presented in Table D3 below. The SICC sectors of finance and other business and<br />
public administration used in the SWMAL have been combined to provide a total estimated<br />
waste stream for office wastes. It is acknowledged that this may cause some inaccuracies for<br />
estimating office wastes. From this table it can be seen that the overwhelming amount of the<br />
total wastes (1.3 million tonnes) are estimated to be paper wastes. Of this, the majority (1.1<br />
million tonnes) are estimated to be potentially recyclable. Putrescible wastes are estimated to<br />
be just under 200,000 tonnes in total, of which the majority (i.e. approximately 165,000<br />
tonnes) are potentially recyclable (i.e. compostable). The vast majority of the estimated<br />
149,000 tonnes of cardboard is also expected to be recyclable. Likewise, the majority of the<br />
99,000 tonnes of glass is also potentially recyclable. Conversely, the majority (133,000 tonnes)<br />
of the plastic wastes is non-recyclable rather than recyclable (20,000 tonnes).<br />
Table D3: Estimated composition of office wastes<br />
Total Recyclable Non-Recyclable<br />
% Tonnes % Tonnes % Tonnes<br />
Paper 65 129 53.6 1,065.7 12.3 244.6<br />
Cardboard 7 139 6.5 129.2 0.6 12<br />
Glass 5 99 4.5 89.5 0 0<br />
Plastic 8 159 1 19.9 6.7 133.2<br />
Ferrous metals 1 20 0.3 6 0.5 9.9<br />
Non-ferrous<br />
metals<br />
1 0 0.7 14 0 0<br />
Putrescible 10 199 8.3 165 1.4 27.8<br />
Textiles 1 20 0 0 0.6 11.9<br />
Miscellaneous<br />
combustible<br />
Miscellaneous<br />
non-combustible<br />
Particles passing<br />
through a 20mm<br />
sieve<br />
0 0 0 0 0.4 8<br />
1 20 0 0 1.1 21.9<br />
1 20 0 0 1.5 29.8<br />
Total 100 1,988.2 74.9 1,489.2 25.1 499<br />
Notes: percentages are taken from the SWAP report. Figures are rounded up.<br />
Other than retail, hospitality and office wastes, the SWAP report does not provide<br />
compositional data for the other commercial sectors presented in the SWMAL, i.e. wholesale<br />
161


