London Wider Waste Strategy - London - Greater London Authority
London Wider Waste Strategy - London - Greater London Authority
London Wider Waste Strategy - London - Greater London Authority
You also want an ePaper? Increase the reach of your titles
YUMPU automatically turns print PDFs into web optimized ePapers that Google loves.
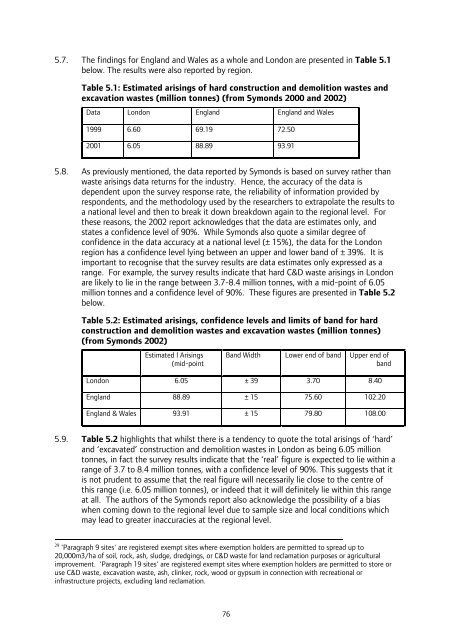
5.7. The findings for England and Wales as a whole and <strong>London</strong> are presented in Table 5.1<br />
below. The results were also reported by region.<br />
Table 5.1: Estimated arisings of hard construction and demolition wastes and<br />
excavation wastes (million tonnes) (from Symonds 2000 and 2002)<br />
Data <strong>London</strong> England England and Wales<br />
1999 6.60 69.19 72.50<br />
2001 6.05 88.89 93.91<br />
5.8. As previously mentioned, the data reported by Symonds is based on survey rather than<br />
waste arisings data returns for the industry. Hence, the accuracy of the data is<br />
dependent upon the survey response rate, the reliability of information provided by<br />
respondents, and the methodology used by the researchers to extrapolate the results to<br />
a national level and then to break it down breakdown again to the regional level. For<br />
these reasons, the 2002 report acknowledges that the data are estimates only, and<br />
states a confidence level of 90%. While Symonds also quote a similar degree of<br />
confidence in the data accuracy at a national level (± 15%), the data for the <strong>London</strong><br />
region has a confidence level lying between an upper and lower band of ± 39%. It is<br />
important to recognise that the survey results are data estimates only expressed as a<br />
range. For example, the survey results indicate that hard C&D waste arisings in <strong>London</strong><br />
are likely to lie in the range between 3.7-8.4 million tonnes, with a mid-point of 6.05<br />
million tonnes and a confidence level of 90%. These figures are presented in Table 5.2<br />
below.<br />
Table 5.2: Estimated arisings, confidence levels and limits of band for hard<br />
construction and demolition wastes and excavation wastes (million tonnes)<br />
(from Symonds 2002)<br />
Estimated l Arisings<br />
(mid-point<br />
Band Width Lower end of band Upper end of<br />
band<br />
<strong>London</strong> 6.05 ± 39 3.70 8.40<br />
England 88.89 ± 15 75.60 102.20<br />
England & Wales 93.91 ± 15 79.80 108.00<br />
5.9. Table 5.2 highlights that whilst there is a tendency to quote the total arisings of ‘hard’<br />
and ‘excavated’ construction and demolition wastes in <strong>London</strong> as being 6.05 million<br />
tonnes, in fact the survey results indicate that the ‘real’ figure is expected to lie within a<br />
range of 3.7 to 8.4 million tonnes, with a confidence level of 90%. This suggests that it<br />
is not prudent to assume that the real figure will necessarily lie close to the centre of<br />
this range (i.e. 6.05 million tonnes), or indeed that it will definitely lie within this range<br />
at all. The authors of the Symonds report also acknowledge the possibility of a bias<br />
when coming down to the regional level due to sample size and local conditions which<br />
may lead to greater inaccuracies at the regional level.<br />
29 'Paragraph 9 sites' are registered exempt sites where exemption holders are permitted to spread up to<br />
20,000m3/ha of soil, rock, ash, sludge, dredgings, or C&D waste for land reclamation purposes or agricultural<br />
improvement. 'Paragraph 19 sites' are registered exempt sites where exemption holders are permitted to store or<br />
use C&D waste, excavation waste, ash, clinker, rock, wood or gypsum in connection with recreational or<br />
infrastructure projects, excluding land reclamation.<br />
76


