

London Wider Waste Strategy - London - Greater London Authority
London Wider Waste Strategy - London - Greater London Authority
London Wider Waste Strategy - London - Greater London Authority

Create successful ePaper yourself
Turn your PDF publications into a flip-book with our unique Google optimized e-Paper software.
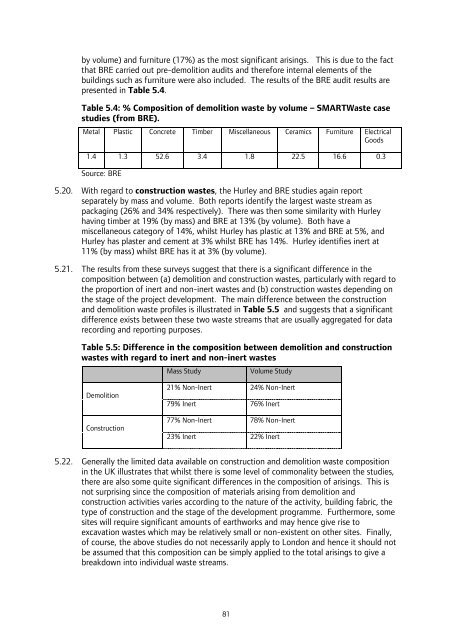
y volume) and furniture (17%) as the most significant arisings. This is due to the fact<br />
that BRE carried out pre-demolition audits and therefore internal elements of the<br />
buildings such as furniture were also included. The results of the BRE audit results are<br />
presented in Table 5.4.<br />
Table 5.4: % Composition of demolition waste by volume – SMART<strong>Waste</strong> case<br />
studies (from BRE).<br />
Metal Plastic Concrete Timber Miscellaneous Ceramics Furniture Electrical<br />
Goods<br />
1.4 1.3 52.6 3.4 1.8 22.5 16.6 0.3<br />
Source: BRE<br />
5.20. With regard to construction wastes, the Hurley and BRE studies again report<br />
separately by mass and volume. Both reports identify the largest waste stream as<br />
packaging (26% and 34% respectively). There was then some similarity with Hurley<br />
having timber at 19% (by mass) and BRE at 13% (by volume). Both have a<br />
miscellaneous category of 14%, whilst Hurley has plastic at 13% and BRE at 5%, and<br />
Hurley has plaster and cement at 3% whilst BRE has 14%. Hurley identifies inert at<br />
11% (by mass) whilst BRE has it at 3% (by volume).<br />
5.21. The results from these surveys suggest that there is a significant difference in the<br />
composition between (a) demolition and construction wastes, particularly with regard to<br />
the proportion of inert and non-inert wastes and (b) construction wastes depending on<br />
the stage of the project development. The main difference between the construction<br />
and demolition waste profiles is illustrated in Table 5.5 and suggests that a significant<br />
difference exists between these two waste streams that are usually aggregated for data<br />
recording and reporting purposes.<br />
Table 5.5: Difference in the composition between demolition and construction<br />
wastes with regard to inert and non-inert wastes<br />
Demolition<br />
Construction<br />
Mass Study Volume Study<br />
21% Non-Inert 24% Non-Inert<br />
79% Inert 76% Inert<br />
77% Non-Inert 78% Non-Inert<br />
23% Inert 22% Inert<br />
5.22. Generally the limited data available on construction and demolition waste composition<br />
in the UK illustrates that whilst there is some level of commonality between the studies,<br />
there are also some quite significant differences in the composition of arisings. This is<br />
not surprising since the composition of materials arising from demolition and<br />
construction activities varies according to the nature of the activity, building fabric, the<br />
type of construction and the stage of the development programme. Furthermore, some<br />
sites will require significant amounts of earthworks and may hence give rise to<br />
excavation wastes which may be relatively small or non-existent on other sites. Finally,<br />
of course, the above studies do not necessarily apply to <strong>London</strong> and hence it should not<br />
be assumed that this composition can be simply applied to the total arisings to give a<br />
breakdown into individual waste streams.<br />
81


