

London Wider Waste Strategy - London - Greater London Authority
London Wider Waste Strategy - London - Greater London Authority
London Wider Waste Strategy - London - Greater London Authority

Create successful ePaper yourself
Turn your PDF publications into a flip-book with our unique Google optimized e-Paper software.
Appendix D: Results of Further Analysis of C&I Compositional Data<br />
Commercial <strong>Waste</strong>s<br />
As described in the C&I chapter, the SWMAL report estimates that 4.35 million tonnes of<br />
<strong>London</strong>’s waste is of commercial origin. This comprises six sectors, i.e. wholesale, retail, hotels<br />
and catering, finance, education, and other business and public administration. Across these six<br />
sectors, a total of 81% (3.5 million tonnes) of the wastes are described as ‘general and<br />
biodegradable’ which indicates that there is little data about their composition. Of the<br />
remainder of the commercial waste streams, the SWMAL estimates that 10% (454,000 tonnes)<br />
is paper and card, 2.6% (114,000 tonnes) is contaminated general, 2% (86,000 tonnes) is<br />
metals and scrap equipment, 1.4% (61,000 tonnes) is food, another 1.4% is chemical and other<br />
wastes, 1.1% is inert and construction and demolition wastes, and 0.09% (4,000 tonnes) are<br />
mineral wastes and residues.<br />
We have used the compositional data from the SWAP report (City of Westminster <strong>Waste</strong><br />
Analysis, SWAP, April 2001) (detailed in the C&I chapter) to try and reduce the uncertainties<br />
caused by the large amount of waste described as general in the commercial waste stream in<br />
the SWMAL. This was done by applying the percentage compositions from the SWAP report for<br />
each of the three sectors surveyed (retail, hospitality and office) to the total tonnages for each<br />
of the relevant sectors in the SWMAL. These are described sector by sector below.<br />
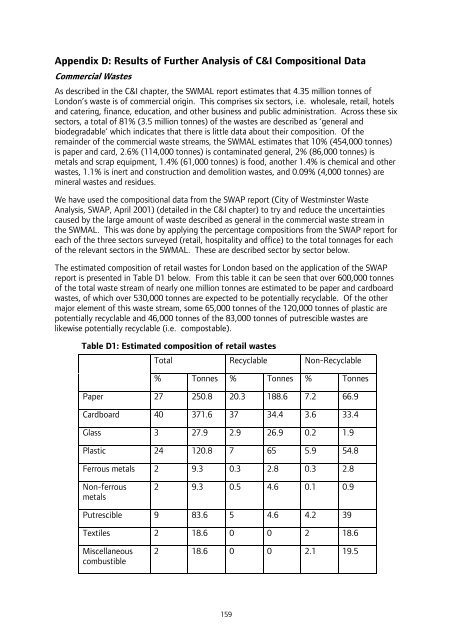
The estimated composition of retail wastes for <strong>London</strong> based on the application of the SWAP<br />
report is presented in Table D1 below. From this table it can be seen that over 600,000 tonnes<br />
of the total waste stream of nearly one million tonnes are estimated to be paper and cardboard<br />
wastes, of which over 530,000 tonnes are expected to be potentially recyclable. Of the other<br />
major element of this waste stream, some 65,000 tonnes of the 120,000 tonnes of plastic are<br />
potentially recyclable and 46,000 tonnes of the 83,000 tonnes of putrescible wastes are<br />
likewise potentially recyclable (i.e. compostable).<br />
Table D1: Estimated composition of retail wastes<br />
Total Recyclable Non-Recyclable<br />
% Tonnes % Tonnes % Tonnes<br />
Paper 27 250.8 20.3 188.6 7.2 66.9<br />
Cardboard 40 371.6 37 34.4 3.6 33.4<br />
Glass 3 27.9 2.9 26.9 0.2 1.9<br />
Plastic 24 120.8 7 65 5.9 54.8<br />
Ferrous metals 2 9.3 0.3 2.8 0.3 2.8<br />
Non-ferrous<br />
metals<br />
2 9.3 0.5 4.6 0.1 0.9<br />
Putrescible 9 83.6 5 4.6 4.2 39<br />
Textiles 2 18.6 0 0 2 18.6<br />
Miscellaneous<br />
combustible<br />
2 18.6 0 0 2.1 19.5<br />
159


