

London Wider Waste Strategy - London - Greater London Authority
London Wider Waste Strategy - London - Greater London Authority
London Wider Waste Strategy - London - Greater London Authority

You also want an ePaper? Increase the reach of your titles
YUMPU automatically turns print PDFs into web optimized ePapers that Google loves.
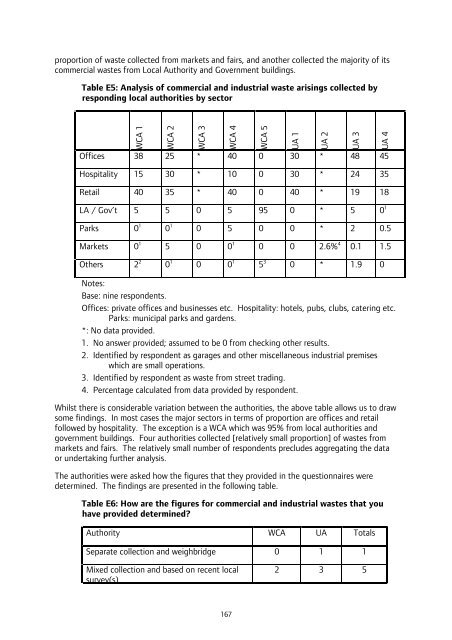
proportion of waste collected from markets and fairs, and another collected the majority of its<br />
commercial wastes from Local <strong>Authority</strong> and Government buildings.<br />
Table E5: Analysis of commercial and industrial waste arisings collected by<br />
responding local authorities by sector<br />
WCA 1<br />
WCA 2<br />
WCA 3<br />
WCA 4<br />
Offices 38 25 * 40 0 30 * 48 45<br />
Hospitality 15 30 * 10 0 30 * 24 35<br />
Retail 40 35 * 40 0 40 * 19 18<br />
LA / Gov’t 5 5 0 5 95 0 * 5 0 1<br />
Parks 0 1 0 1 0 5 0 0 * 2 0.5<br />
Markets 0 1 5 0 0 1 0 0 2.6% 4 0.1 1.5<br />
Others 2 2<br />
WCA 5<br />
UA 1<br />
UA 2<br />
UA 3<br />
0 1 0 0 1 5 3 0 * 1.9 0<br />
Notes:<br />
Base: nine respondents.<br />
Offices: private offices and businesses etc. Hospitality: hotels, pubs, clubs, catering etc.<br />
Parks: municipal parks and gardens.<br />
*: No data provided.<br />
1. No answer provided; assumed to be 0 from checking other results.<br />
2. Identified by respondent as garages and other miscellaneous industrial premises<br />
which are small operations.<br />
3. Identified by respondent as waste from street trading.<br />
4. Percentage calculated from data provided by respondent.<br />
Whilst there is considerable variation between the authorities, the above table allows us to draw<br />
some findings. In most cases the major sectors in terms of proportion are offices and retail<br />
followed by hospitality. The exception is a WCA which was 95% from local authorities and<br />
government buildings. Four authorities collected [relatively small proportion] of wastes from<br />
markets and fairs. The relatively small number of respondents precludes aggregating the data<br />
or undertaking further analysis.<br />
The authorities were asked how the figures that they provided in the questionnaires were<br />
determined. The findings are presented in the following table.<br />
Table E6: How are the figures for commercial and industrial wastes that you<br />
have provided determined?<br />
<strong>Authority</strong> WCA UA Totals<br />
Separate collection and weighbridge 0 1 1<br />
Mixed collection and based on recent local<br />
survey(s)<br />
167<br />
2 3 5<br />
UA 4


