

London Wider Waste Strategy - London - Greater London Authority
London Wider Waste Strategy - London - Greater London Authority
London Wider Waste Strategy - London - Greater London Authority

Create successful ePaper yourself
Turn your PDF publications into a flip-book with our unique Google optimized e-Paper software.
<strong>Waste</strong> Growth<br />
6.41. Overall, the Environment Agency has reported no growth in consigned hazardous waste<br />
arisings for England and Wales between 1998/99 to 2002, with construction and<br />
demolition and asbestos, and oil and oil/water mixtures comprising the majority of the<br />
hazardous waste throughout.<br />
6.42. However, although there has been no growth in consigned hazardous waste in England<br />
and Wales, the pattern of arisings in <strong>London</strong> over the last 4 documented years is rather<br />
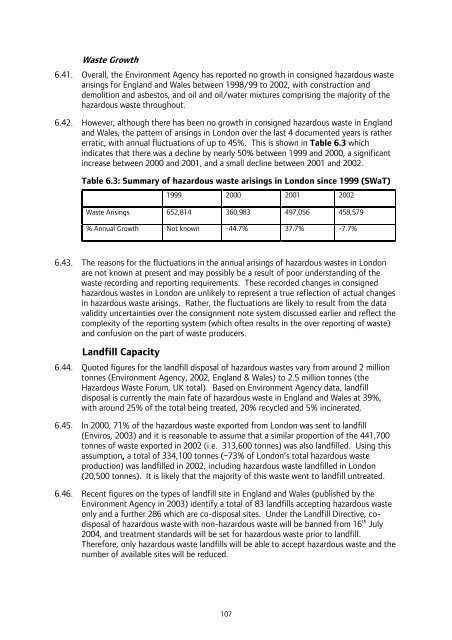
erratic, with annual fluctuations of up to 45%. This is shown in Table 6.3 which<br />
indicates that there was a decline by nearly 50% between 1999 and 2000, a significant<br />
increase between 2000 and 2001, and a small decline between 2001 and 2002.<br />
Table 6.3: Summary of hazardous waste arisings in <strong>London</strong> since 1999 (SWaT)<br />
1999 2000 2001 2002<br />
<strong>Waste</strong> Arisings 652,814 360,983 497,056 458,579<br />
% Annual Growth Not known -44.7% 37.7% -7.7%<br />
6.43. The reasons for the fluctuations in the annual arisings of hazardous wastes in <strong>London</strong><br />
are not known at present and may possibly be a result of poor understanding of the<br />
waste recording and reporting requirements. These recorded changes in consigned<br />
hazardous wastes in <strong>London</strong> are unlikely to represent a true reflection of actual changes<br />
in hazardous waste arisings. Rather, the fluctuations are likely to result from the data<br />
validity uncertainties over the consignment note system discussed earlier and reflect the<br />
complexity of the reporting system (which often results in the over reporting of waste)<br />
and confusion on the part of waste producers.<br />
Landfill Capacity<br />
6.44. Quoted figures for the landfill disposal of hazardous wastes vary from around 2 million<br />
tonnes (Environment Agency, 2002, England & Wales) to 2.5 million tonnes (the<br />
Hazardous <strong>Waste</strong> Forum, UK total). Based on Environment Agency data, landfill<br />
disposal is currently the main fate of hazardous waste in England and Wales at 39%,<br />
with around 25% of the total being treated, 20% recycled and 5% incinerated.<br />
6.45. In 2000, 71% of the hazardous waste exported from <strong>London</strong> was sent to landfill<br />
(Enviros, 2003) and it is reasonable to assume that a similar proportion of the 441,700<br />
tonnes of waste exported in 2002 (i.e. 313,600 tonnes) was also landfilled. Using this<br />
assumption, a total of 334,100 tonnes (~73% of <strong>London</strong>’s total hazardous waste<br />
production) was landfilled in 2002, including hazardous waste landfilled in <strong>London</strong><br />
(20,500 tonnes). It is likely that the majority of this waste went to landfill untreated.<br />
6.46. Recent figures on the types of landfill site in England and Wales (published by the<br />
Environment Agency in 2003) identify a total of 83 landfills accepting hazardous waste<br />
only and a further 286 which are co-disposal sites. Under the Landfill Directive, codisposal<br />
of hazardous waste with non-hazardous waste will be banned from 16 th July<br />
2004, and treatment standards will be set for hazardous waste prior to landfill.<br />
Therefore, only hazardous waste landfills will be able to accept hazardous waste and the<br />
number of available sites will be reduced.<br />
107


