

London Wider Waste Strategy - London - Greater London Authority
London Wider Waste Strategy - London - Greater London Authority
London Wider Waste Strategy - London - Greater London Authority

Create successful ePaper yourself
Turn your PDF publications into a flip-book with our unique Google optimized e-Paper software.
Miscellaneous<br />
non-combustible<br />
Particles passing<br />
through a 20mm<br />
sieve<br />
1 9.3 0 0 1 20<br />
1 9.3 4 24 1 20<br />
Total 100 928.9 100 598.8 100 1,988.2<br />
Note: Tonnes are in 000 tonnes. Figures have been rounded up.<br />
4.35. From Table 4.7 it can be seen that paper and cardboard make up a very large proportion<br />
of both office (73%), and retail wastes (67%). Whilst this is also an important waste<br />
stream within the hospitality sector (23%), glass is by far the highest with 41%. Glass is<br />
very much lower in retail (3%) and offices (5%). Putrescible wastes are also high in<br />
hospitality (20%) whilst they are half this in office and retail. The other significant<br />
waste stream within these sectors is plastic with 13% in retail, 7% in hospitality and 8%<br />
in offices.<br />
4.36. Consideration should be given to the possible sources of the different wastes identified<br />
in the above tables. A significant amount of the cardboard is expected to come from<br />
packaging in all sectors. A high proportion of plastics are expected to be packaging<br />
wastes in the retail and office sectors, but these are perhaps more likely to be from drink<br />
and food containers in the hospitality sector. The putrescible wastes within offices are<br />
likely to mainly arise from staff canteens, discarded lunches and also hospitality events.<br />
Within retail this will also include food wastes from discarded products, whilst in<br />
hospitality this will also include waste food. This does not include separately collected<br />
cooking oils/fats from pubs and restaurants etc.<br />
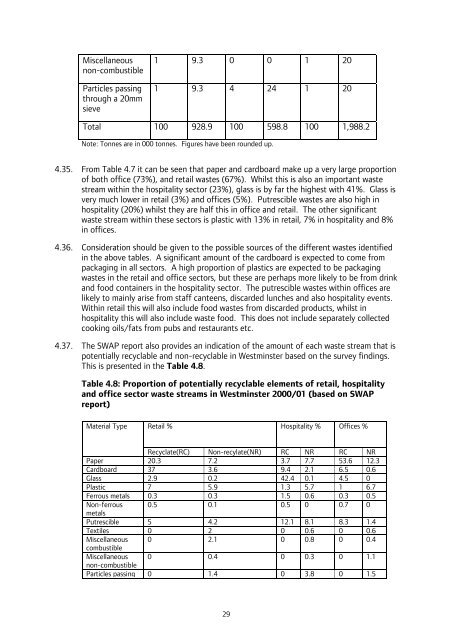
4.37. The SWAP report also provides an indication of the amount of each waste stream that is<br />
potentially recyclable and non-recyclable in Westminster based on the survey findings.<br />
This is presented in the Table 4.8.<br />
Table 4.8: Proportion of potentially recyclable elements of retail, hospitality<br />
and office sector waste streams in Westminster 2000/01 (based on SWAP<br />
report)<br />
Material Type<br />
Retail % Hospitality % Offices %<br />
Recyclate(RC) Non-recylate(NR) RC NR RC NR<br />
Paper 20.3 7.2 3.7 7.7 53.6 12.3<br />
Cardboard 37 3.6 9.4 2.1 6.5 0.6<br />
Glass 2.9 0.2 42.4 0.1 4.5 0<br />
Plastic 7 5.9 1.3 5.7 1 6.7<br />
Ferrous metals 0.3 0.3 1.5 0.6 0.3 0.5<br />
Non-ferrous<br />
metals<br />
0.5 0.1 0.5 0 0.7 0<br />
Putrescible 5 4.2 12.1 8.1 8.3 1.4<br />
Textiles 0 2 0 0.6 0 0.6<br />
Miscellaneous<br />
combustible<br />
0 2.1 0 0.8 0 0.4<br />
Miscellaneous<br />
non-combustible<br />
0 0.4 0 0.3 0 1.1<br />
Particles passing 0 1.4 0 3.8 0 1.5<br />
29


