

London Wider Waste Strategy - London - Greater London Authority
London Wider Waste Strategy - London - Greater London Authority
London Wider Waste Strategy - London - Greater London Authority

Create successful ePaper yourself
Turn your PDF publications into a flip-book with our unique Google optimized e-Paper software.
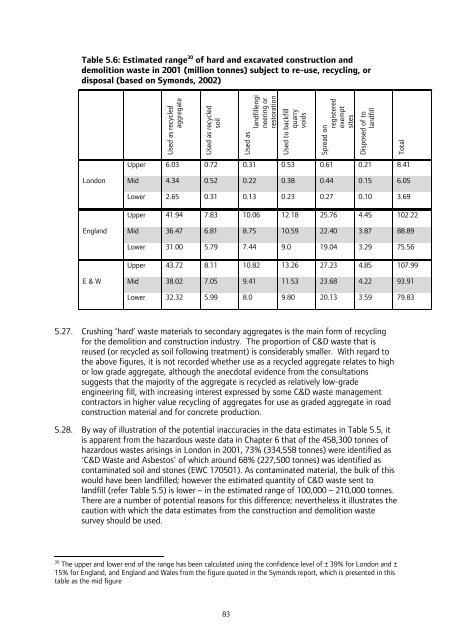
Table 5.6: Estimated range 30 of hard and excavated construction and<br />
demolition waste in 2001 (million tonnes) subject to re-use, recycling, or<br />
disposal (based on Symonds, 2002)<br />
Used as recycled<br />
aggregate<br />
Used as recycled<br />
soil<br />
Used as<br />
landfillengi<br />
neering or<br />
restoration<br />
Used to backfill<br />
quarry<br />
voids<br />
Spread on<br />
registered<br />
exempt<br />
sites<br />
Disposed of to<br />
landfill<br />
Upper 6.03 0.72 0.31 0.53 0.61 0.21 8.41<br />
<strong>London</strong> Mid 4.34 0.52 0.22 0.38 0.44 0.15 6.05<br />
Lower 2.65 0.31 0.13 0.23 0.27 0.10 3.69<br />
Upper 41.94 7.83 10.06 12.18 25.76 4.45 102.22<br />
England Mid 36.47 6.81 8.75 10.59 22.40 3.87 88.89<br />
Lower 31.00 5.79 7.44 9.0 19.04 3.29 75.56<br />
Upper 43.72 8.11 10.82 13.26 27.23 4.85 107.99<br />
E & W Mid 38.02 7.05 9.41 11.53 23.68 4.22 93.91<br />
Lower 32.32 5.99 8.0 9.80 20.13 3.59 79.83<br />
5.27. Crushing ‘hard’ waste materials to secondary aggregates is the main form of recycling<br />
for the demolition and construction industry. The proportion of C&D waste that is<br />
reused (or recycled as soil following treatment) is considerably smaller. With regard to<br />
the above figures, it is not recorded whether use as a recycled aggregate relates to high<br />
or low grade aggregate, although the anecdotal evidence from the consultations<br />
suggests that the majority of the aggregate is recycled as relatively low-grade<br />
engineering fill, with increasing interest expressed by some C&D waste management<br />
contractors in higher value recycling of aggregates for use as graded aggregate in road<br />
construction material and for concrete production.<br />
5.28. By way of illustration of the potential inaccuracies in the data estimates in Table 5.5, it<br />
is apparent from the hazardous waste data in Chapter 6 that of the 458,300 tonnes of<br />
hazardous wastes arisings in <strong>London</strong> in 2001, 73% (334,558 tonnes) were identified as<br />
‘C&D <strong>Waste</strong> and Asbestos’ of which around 68% (227,500 tonnes) was identified as<br />
contaminated soil and stones (EWC 170501). As contaminated material, the bulk of this<br />
would have been landfilled; however the estimated quantity of C&D waste sent to<br />
landfill (refer Table 5.5) is lower – in the estimated range of 100,000 – 210,000 tonnes.<br />
There are a number of potential reasons for this difference; nevertheless it illustrates the<br />
caution with which the data estimates from the construction and demolition waste<br />
survey should be used.<br />
30 The upper and lower end of the range has been calculated using the confidence level of ± 39% for <strong>London</strong> and ±<br />
15% for England, and England and Wales from the figure quoted in the Symonds report, which is presented in this<br />
table as the mid figure<br />
83<br />
Total


