

London Wider Waste Strategy - London - Greater London Authority
London Wider Waste Strategy - London - Greater London Authority
London Wider Waste Strategy - London - Greater London Authority

Create successful ePaper yourself
Turn your PDF publications into a flip-book with our unique Google optimized e-Paper software.
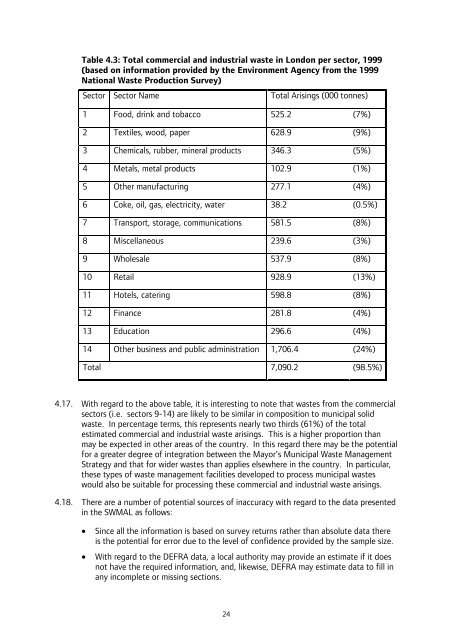
Table 4.3: Total commercial and industrial waste in <strong>London</strong> per sector, 1999<br />
(based on information provided by the Environment Agency from the 1999<br />
National <strong>Waste</strong> Production Survey)<br />
Sector Sector Name Total Arisings (000 tonnes)<br />
1 Food, drink and tobacco 525.2 (7%)<br />
2 Textiles, wood, paper 628.9 (9%)<br />
3 Chemicals, rubber, mineral products 346.3 (5%)<br />
4 Metals, metal products 102.9 (1%)<br />
5 Other manufacturing 277.1 (4%)<br />
6 Coke, oil, gas, electricity, water 38.2 (0.5%)<br />
7 Transport, storage, communications 581.5 (8%)<br />
8 Miscellaneous 239.6 (3%)<br />
9 Wholesale 537.9 (8%)<br />
10 Retail 928.9 (13%)<br />
11 Hotels, catering 598.8 (8%)<br />
12 Finance 281.8 (4%)<br />
13 Education 296.6 (4%)<br />
14 Other business and public administration 1,706.4 (24%)<br />
Total 7,090.2 (98.5%)<br />
4.17. With regard to the above table, it is interesting to note that wastes from the commercial<br />
sectors (i.e. sectors 9-14) are likely to be similar in composition to municipal solid<br />
waste. In percentage terms, this represents nearly two thirds (61%) of the total<br />
estimated commercial and industrial waste arisings. This is a higher proportion than<br />
may be expected in other areas of the country. In this regard there may be the potential<br />
for a greater degree of integration between the Mayor’s Municipal <strong>Waste</strong> Management<br />
<strong>Strategy</strong> and that for wider wastes than applies elsewhere in the country. In particular,<br />
these types of waste management facilities developed to process municipal wastes<br />
would also be suitable for processing these commercial and industrial waste arisings.<br />
4.18. There are a number of potential sources of inaccuracy with regard to the data presented<br />
in the SWMAL as follows:<br />
• Since all the information is based on survey returns rather than absolute data there<br />
is the potential for error due to the level of confidence provided by the sample size.<br />
• With regard to the DEFRA data, a local authority may provide an estimate if it does<br />
not have the required information, and, likewise, DEFRA may estimate data to fill in<br />
any incomplete or missing sections.<br />
24


